Page 1 of 15
CM9.{1,7} | CM9.{1,7} | Demographic Concepts and Vital Statistics Sources — SDL Guide
Learning Objectives
- Define demography and describe its scope in the context of public health
- Describe the demographic cycle and the four stages of the demographic transition model
- Enumerate and differentiate the major sources of vital statistics in India — CRS, Census, SRS, NFHS, NSSO
- Explain the purpose, periodicity, coverage, and limitations of each vital statistics source
- Interpret India's current demographic position using SRS and NFHS-5 data
INSTRUCTIONS
Understanding where India's population data comes from — and what that data means — is a core competency for every community medicine practitioner. National health planning, resource allocation, and programme monitoring all depend on reliable vital statistics. This module builds the conceptual and analytical foundation you need to read, interpret, and critically appraise demographic data in your clinical and public health career.
References
- Park K. Parks Textbook of Preventive and Social Medicine, 26th ed., Ch. 2 — Demography and Family Planning (textbook)
- Sample Registration System Statistical Report 2020, Registrar General of India (report)
- National Family Health Survey (NFHS-5) 2019-21, Ministry of Health & Family Welfare, India (survey)
Version 2.0 | NMC CBUC 2024
CLINICAL SCENARIO
In 2023, India became the world's most populous nation — surpassing China with 1.43 billion people. Yet this headline number tells us almost nothing useful. A district health officer in Bihar faces a very different challenge from a counterpart in Kerala, even though both are working in the same country with the same national programmes. How does the health officer actually know what is happening in their district — how many babies were born last month, how many elderly residents died, what the birth-to-death ratio implies for future demand on the district hospital? The answer lies in vital statistics: the continuous, systematic collection of data on births, deaths, and population movement. In this module we will trace how that data is generated in India, what its limitations are, and how understanding the demographic transition model helps us interpret what we see.
WHY THIS MATTERS
Demography is not an abstract academic exercise — it is the evidence base for every community medicine decision you will make. When you counsel a family on spacing of children, the TFR data tells you the societal context of fertility decisions in your region. When you allocate PHC staff, census and SRS data determine catchment populations and expected workload. When you write a project proposal for a non-governmental organisation, NFHS data legitimises your baseline and your target indicators. The demographic transition model tells you whether a community is on a trajectory of exploding growth or approaching stabilisation — and that trajectory determines whether preventive or curative services, maternity care or geriatric care, should be the priority investment.
RECALL
Before we go further, recall from your first-year Preventive and Social Medicine orientation: (1) India conducts a national census every ten years — the last completed census was in 2011 (the 2021 census was postponed). (2) You have encountered the terms 'birth rate' and 'death rate' — these express events per 1,000 population per year. (3) From your first-year community postings, you will remember filling out birth and death registers in the subcentre — this is the civil registration system in action. Keep these anchors in mind as we build the full picture.
The Population Problem: Why Demography Matters
Demography is the scientific study of human populations — their size, structure, distribution, and dynamics over time. The word comes from the Greek demos (people) and graphos (description). For community medicine, demography is the discipline that converts the lived experience of communities into measurable quantities that guide policy and planning.
The scale of India's demographic challenge is best appreciated through numbers. India's population crossed one billion in 2000, 1.21 billion at the 2011 Census, and an estimated 1.43 billion in 2023 — making it the world's most populous country. With a population growth rate of approximately 1.0% per year and a base of 1.4 billion, India adds roughly 14 million people annually — equivalent to adding the entire population of metropolitan Mumbai every year. This growth exerts enormous pressure on food systems, water resources, healthcare infrastructure, educational institutions, and employment markets.
The consequences of unchecked population growth for health are direct and measurable. Countries or regions with rapid population growth consistently show higher infant mortality rates, lower per capita health expenditure, greater disease burden from poverty-linked infections (tuberculosis, diarrhoeal diseases), and worse maternal health outcomes because health systems cannot scale as fast as population. Understanding where a community sits in its demographic trajectory — growing rapidly, stabilising, or ageing — is the first step to rational health planning.
Beyond India's numbers, global context matters. Sub-Saharan Africa currently has the world's highest growth rates, while Japan and parts of Europe face population decline and rapid ageing. Comparative demography shows that economic development, female education, and healthcare access consistently produce demographic convergence toward lower fertility and lower mortality — the central insight of the demographic transition model.
Principles and Scope of Demography
Demography operates at two scales. Formal demography uses mathematical models to describe population size, age-sex structure, and vital rates with precision — it answers 'how many' and 'at what rate.' Population studies (or social demography) situate those numbers within their social, economic, and cultural context — explaining why birth rates are falling in Maharashtra but remaining high in Bihar, for example. In public health practice, both scales matter: the formal rate tells you the magnitude of the problem, and the social context tells you how to intervene.
To understand where a population is going, we need to understand where it has been. The history of human population change is not random — it follows a broadly predictable trajectory tied to economic development, healthcare access, and female empowerment. This trajectory is described by two related concepts: the demographic cycle and the demographic transition model.
The demographic cycle describes a community's population trajectory across historical time. Park (26th ed.) identifies four broad phases aligned with economic and epidemiological development:
- High stationary (pre-modern societies): Both birth rate and death rate are high (both ≥35 per 1,000). Population growth is minimal because births and deaths roughly balance. Infectious diseases, famine, and war cause high and variable mortality.
- Early expanding (industrialisation begins): Death rate falls sharply — improvements in nutrition, water supply, and basic sanitation reduce infectious disease mortality — while birth rate remains high. The gap between the two drives rapid population growth. India was broadly in this phase from the 1920s to 1960s.
- Late expanding (economic and social development): Birth rate begins to fall as female literacy rises, family planning services expand, and the cost of raising children increases with urbanisation. Death rate continues to fall, but more slowly. Net growth remains positive but decelerating.
- Low stationary (post-transition): Both birth rate and death rate are low (both <15 per 1,000). Population stabilises. Developed nations (Germany, Japan) have passed through this stage and some are in net decline.
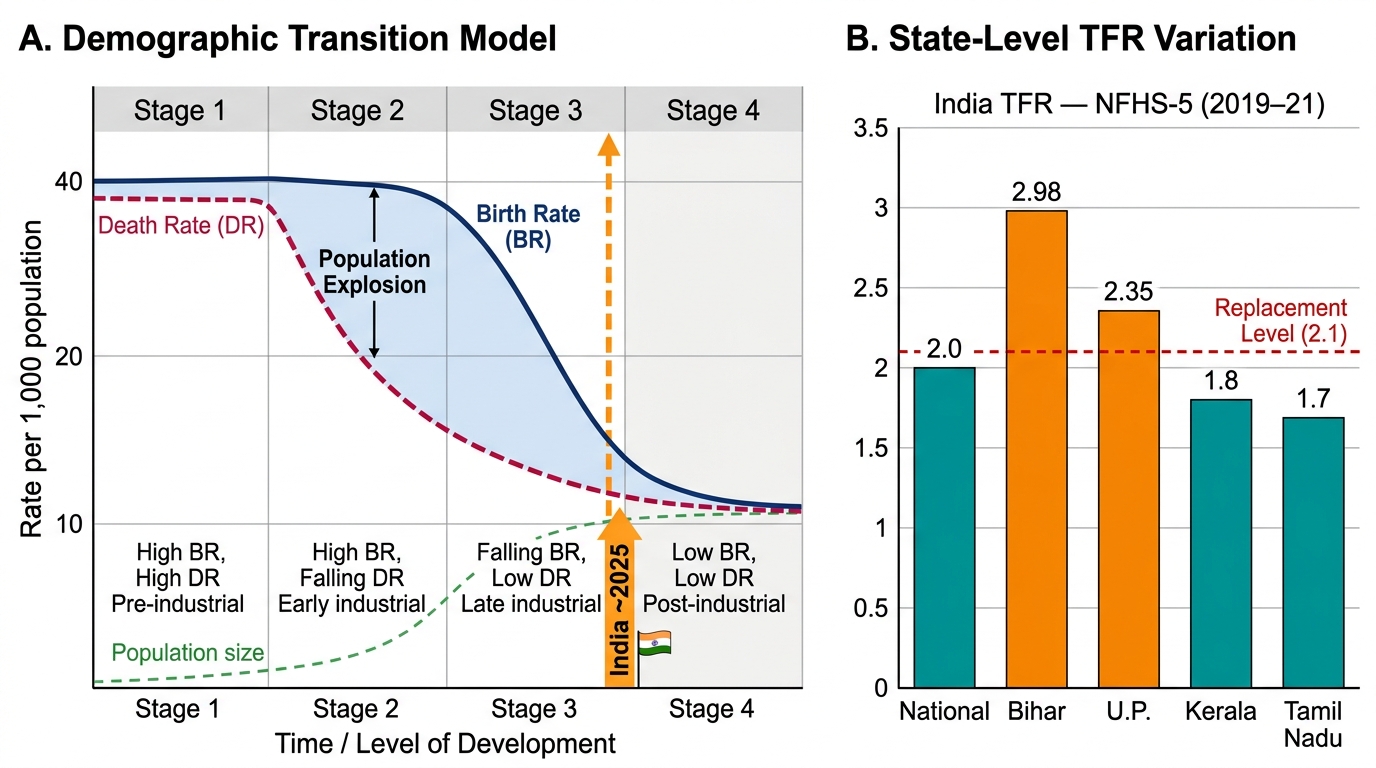
The demographic transition model formalises this into four stages using the birth rate and death rate curves:
| Stage | Birth Rate | Death Rate | Net Growth | Example |
|---|---|---|---|---|
| 1 — High stationary | High (>35) | High (>35) | Near zero | Pre-industrial Europe |
| 2 — Early expanding | High (>30) | Falling | Rapid growth | Africa (current), India 1920s-60s |
| 3 — Late expanding | Falling | Low | Moderate growth | India today (some states) |
| 4 — Low stationary | Low (<15) | Low (<15) | Near zero | Western Europe, Japan |
India as a whole sits between stages 3 and 4 — the national TFR of 2.0 (NFHS-5, 2019-21) is at or below replacement, but there is enormous state-level heterogeneity. Bihar's TFR (2.98) and Uttar Pradesh's (2.35) are still in Stage 3, while Kerala (1.8), Tamil Nadu (1.7), and Andhra Pradesh (1.7) have completed the transition.
Demographic Transition Model and India's Fertility Position (NFHS-5)
SELF-CHECK
India's national Total Fertility Rate (TFR) as reported by NFHS-5 (2019-21) is approximately:
A. 2.8 — still well above replacement
B. 2.0 — at or near replacement level
C. 1.5 — below replacement, declining
D. 3.5 — indicating rapid population growth
Reveal Answer
Answer: B. 2.0 — at or near replacement level
NFHS-5 (2019-21) reports India's national TFR as 2.0 — effectively at replacement level (2.1 in low-mortality populations). However, there is significant state-level variation: Bihar (2.98), UP (2.35) are still above replacement, while Kerala (1.8), Tamil Nadu (1.7) have completed the transition. The overall national figure masks these geographic disparities that require state-specific health planning.
Sources of Vital Statistics in India
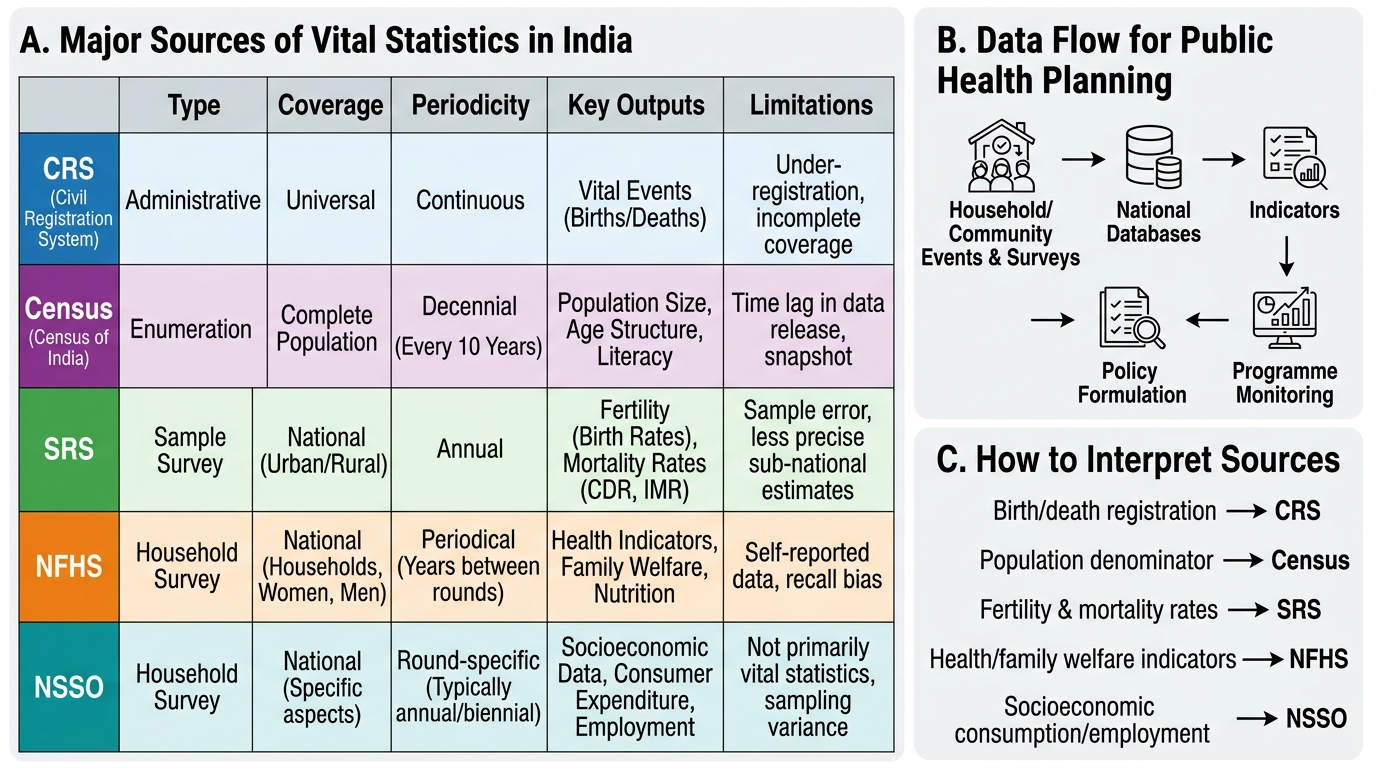
Vital statistics are the numerical records of key biological and social events — births, deaths, marriages, and migrations — that define a population's composition and trajectory. In India, these data are generated by five principal institutional mechanisms, each with distinct coverage, methodology, periodicity, and limitations. No single source is complete; the health professional must understand what each source measures and where its blind spots lie.
1. Civil Registration System (CRS)
The CRS is India's system for compulsory registration of births, deaths, marriages, and still-births under the Registration of Births and Deaths Act (RBD Act) 1969. Registration is a legal obligation: every birth must be registered within 21 days, and every death within the stipulated time frame. In theory, complete CRS data would provide a continuous, universal, and instantaneous record of all vital events. In practice, registration completeness in India is uneven: the SRS Compendium 2020 estimates birth registration completeness at approximately 89–93% nationally, with rural areas lagging urban ones. Death registration is even lower, with cause-of-death data particularly unreliable in peripheral areas where deaths occur without medical certification.
2. Census
India conducts a decennial census — once every ten years — under the Census Act 1948, directed by the Office of the Registrar General of India (RGI). Every person present in India on census night is counted, regardless of citizenship. The census provides age, sex, marital status, literacy, occupation, housing, and disability data down to the village level. India's last completed census was in 2011; the 2021 census was postponed due to the COVID-19 pandemic. The census is the gold standard for population size and structure but provides only a cross-sectional snapshot every decade, making intercensal interpolation (projections) necessary.
3. Sample Registration System (SRS)
The SRS is a large-scale continuous demographic survey operated by the RGI. It uses a dual-record system: enumerators register vital events continuously in sample units, and a supervisor independently conducts a six-monthly household survey. Matching the two records identifies both over-registration and under-registration, making SRS estimates more reliable than raw CRS data. The SRS covers approximately 8,800 sample units (7,600 rural + 1,200 urban), covering about 8 million persons — roughly 0.6% of India's population. It produces annual state-level estimates of CBR, CDR, IMR, and other vital rates. The limitation is that sample sizes at the district level are insufficient for local planning.
4. National Family Health Survey (NFHS)
The NFHS is a cross-sectional household survey conducted periodically (roughly every four to five years) by the International Institute for Population Sciences (IIPS), Mumbai, under the Ministry of Health and Family Welfare. NFHS-5 (2019-21) is the most recent round, covering 636,699 households across all 28 states and 8 Union Territories. The NFHS goes beyond vital rates to cover fertility preferences, contraceptive use, maternal and child health indicators (anaemia, stunting, wasting), and nutrition. It is the primary source for TFR, under-5 mortality, institutional delivery rates, and child immunisation coverage. Its limitation is periodicity — data can be four to five years old by the time results are published.
5. National Sample Survey Office (NSSO)
The NSSO (now integrated into the National Statistical Office, NSO) conducts periodic multi-round household surveys on socioeconomic indicators — employment, consumer expenditure, morbidity, healthcare utilisation. While not a primary source of vital rates, NSSO morbidity surveys provide health service utilisation data essential for planning. The 75th round (2017-18) National Health Survey reported out-of-pocket expenditure and barriers to healthcare access.
Other sources include the Hospital Information Management System (HMIS) under the National Health Mission (NHM), which aggregates facility-level data monthly; the Annual Health Survey (AHS) conducted in Empowered Action Group (EAG) states; and the District Level Household and Facility Survey (DLHS). The International Classification of Diseases (ICD) system provides the coding framework for cause-of-death reporting.
Sources of Vital Statistics in India
SELF-CHECK
The Sample Registration System (SRS) uses which methodological feature to improve the reliability of its vital statistics estimates?
A. Universal mandatory registration under the RBD Act 1969
B. A dual-record system combining continuous registration with independent household surveys
C. Decennial complete enumeration of all households
D. Self-reported household data through mobile surveys
Reveal Answer
Answer: B. A dual-record system combining continuous registration with independent household surveys
The SRS uses a dual-record system: enumerators continuously register vital events in sample units AND a supervisor independently conducts a six-monthly retrospective household survey. Matching these two independent records identifies both missed events (under-registration) and phantom events (over-registration), making SRS estimates more reliable than raw CRS data alone. The Census (option C) does decennial complete enumeration, but it does not produce annual vital rates.