Page 1 of 21
CM7.{1,3} | CM7.{1,3} | Epidemiology Concepts and Data Sources — SDL Guide
Learning Objectives
- Define epidemiology and describe its core principles, concepts, and uses (CM7.1)
- Enumerate and describe the major sources of epidemiological data available in India (CM7.3)
- Evaluate the strengths and limitations of different data sources for specific epidemiological questions
INSTRUCTIONS
Epidemiology is the scientific foundation of all public health action. Understanding what epidemiology measures, how it conceptualises disease in populations, and where reliable data come from is essential before any intervention can be designed, evaluated, or compared across communities. This module equips you with the definitional, conceptual, and data-source literacy that underpins every subsequent Community Medicine topic.
References
- Park's Textbook of Preventive and Social Medicine, 27th edition — Chapter 2: Epidemiology (textbook)
- Last JM. A Dictionary of Epidemiology, 4th edition. Oxford University Press (textbook)
Version 2.0 | NMC CBUC 2024
CLINICAL SCENARIO
In 1854, cholera was killing hundreds of Londoners each week. Physician John Snow did not know what caused cholera — germ theory had not yet been established — but by mapping where cases clustered around a single water pump on Broad Street, he convinced authorities to remove the pump handle. Deaths plummeted. Snow had never used the word 'epidemiology', yet he demonstrated its most powerful principle: that the systematic study of where, when, and in whom disease occurs can point directly to its cause — and to the intervention that will stop it. Today, the same logic underpins India's disease surveillance systems, COVID-19 response, and every national health programme you will one day implement as a doctor.
WHY THIS MATTERS
As a Year-2 student you are transitioning from understanding how individual bodies work to understanding how health and disease behave across populations. Epidemiology is the bridge: it translates biological mechanisms into measurable patterns, measurable patterns into causal hypotheses, and causal hypotheses into policies. Every clinical guideline you will follow, every vaccine schedule you will prescribe, and every priority you will set in a district health programme rests on epidemiological evidence. Understanding its concepts and data sources is not optional background — it is the core competency through which community medicine practitioners think.
RECALL
Before we build on the foundations, recall from Year-1 basic sciences: (1) Population is the entire group of interest; a sample is a subset drawn from it — epidemiology works primarily at the population level, but uses sample-based surveys when population enumeration is impractical. (2) A variable is any characteristic that can take different values; categorical variables (disease yes/no) and continuous variables (blood pressure) are measured differently. (3) India's population of approximately 1.4 billion — organised into states, districts, blocks, and villages — is the field within which Indian epidemiology operates. Keeping these anchors in mind helps you situate the definitions ahead.
The Burden Epidemiology Carries: Why We Measure Health
Every health system decision — which diseases to prioritise, how many beds to commission, which vaccine to fund — must answer a prior question: how much disease exists, where, and in whom? Without measurement, health systems operate on intuition rather than evidence, and resources flow to the politically visible rather than the epidemiologically urgent. The global burden of disease framework, developed by the WHO and the Institute for Health Metrics and Evaluation, estimates that in 2019 approximately 55 million people died worldwide, with non-communicable diseases accounting for roughly 74% of all deaths. India carries a disproportionate share: cardiovascular disease, lower respiratory infections, diarrhoeal diseases, tuberculosis, and road-traffic injuries together account for the majority of India's premature mortality. These numbers did not emerge from guesswork — they were built from the epidemiological data sources you will study in this module.
The uses of epidemiology extend far beyond counting the dead. Park identifies eight uses: (1) to study the history of health in populations and predict future trends; (2) to diagnose the health of the community and identify problems; (3) to study the working of health services and their adequacy; (4) to estimate individual risks from population data; (5) to complete the clinical picture of chronic disease by identifying the full spectrum of expression; (6) to identify syndromes by describing the distribution of clinical phenomena; (7) to search for causes and risk factors by comparing populations; and (8) to test preventive and therapeutic measures. Each use demands reliable data — which is why data sources are inseparable from the discipline's principles.
Defining Epidemiology: Core Concepts and Principles
The most widely used definition, adopted by Last's Dictionary of Epidemiology and echoed in Park, states: epidemiology is the study of the distribution and determinants of health-related states or events in specified populations, and the application of this study to the control of health problems. Each word in this definition carries weight. Distribution refers to the frequency and pattern of health events: who is affected (person), where (place), and when (time) — the three axes of descriptive epidemiology. Determinants refers to the causal and risk factors that influence distribution — the domain of analytical epidemiology. Specified populations reminds us that epidemiology is not about individual patients but about groups. Application marks the discipline's action orientation: description and analysis serve control.
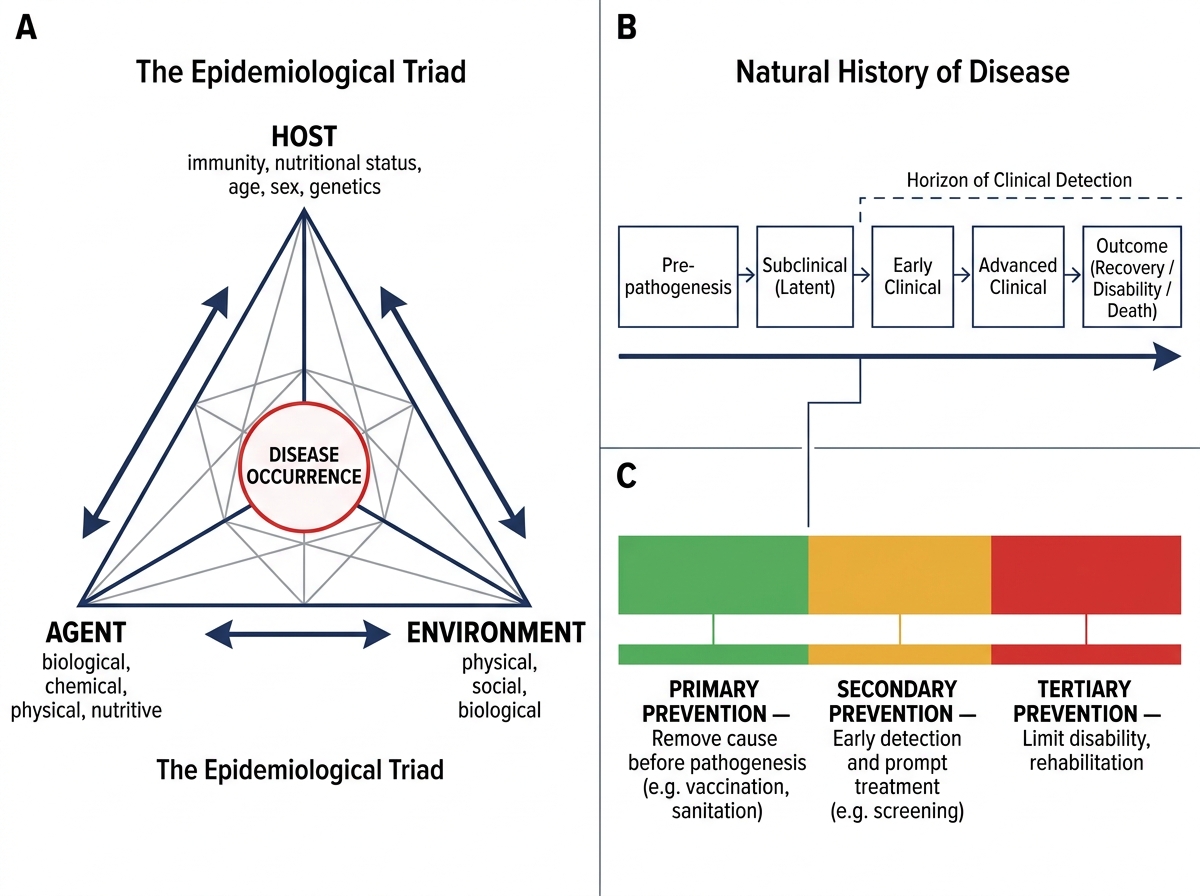
The epidemiological triad (also called the ecological triad) provides a conceptual model for communicable disease: disease emerges from an imbalance among three interacting components — the host (the susceptible human, including age, sex, immunity, nutritional status, and behaviour), the agent (the biological, chemical, physical, nutritional, or social factor capable of causing disease), and the environment (the external conditions — physical, biological, and socioeconomic — that mediate host-agent contact). For communicable diseases, this triad is sufficient; for chronic non-communicable disease, Gordis and others propose the web of causation — a more complex representation that acknowledges multiple interacting risk pathways without a single necessary agent.
The person-place-time framework is the operational tool of descriptive epidemiology. Person variables include age, sex, occupation, ethnicity, socioeconomic status, and marital status — each may reveal a distinct risk pattern. Place variables include country, region, urban/rural classification, and altitude — geographical patterns suggest environmental or occupational determinants. Time variables include secular trends (long-term shifts), seasonal patterns, cyclic fluctuations, and epidemic curves — temporal patterns suggest infectious exposure windows, seasonal vectors, or policy effects.
IMMAGE_NEEDED: diagram of the epidemiological triad showing host, agent, and environment at three vertices with a web-of-causation overlay illustrating their interactions
Epidemiological Triad, Web of Causation, and Levels of Prevention
The natural history of disease — from pre-pathogenesis through clinical disease to outcome — is the timeline within which epidemiology operates. Primary prevention acts before pathogenesis begins (e.g. vaccination); secondary prevention acts during early detectable disease (e.g. screening); tertiary prevention limits disability from established disease (e.g. rehabilitation). Levels of prevention align directly with Leavell and Clark's levels, which you will revisit in screening.
SELF-CHECK
Which component of the epidemiological triad includes a person's immunisation status and nutritional state?
A. Agent
B. Environment
C. Host
D. Vector
Reveal Answer
Answer: C. Host
The host component of the epidemiological triad encompasses all characteristics of the susceptible individual that affect disease risk, including immunity (natural or vaccine-induced), nutritional status, age, sex, and genetic factors. The agent is the causative factor; the environment mediates host-agent contact; the vector (a subset of environment) transmits the agent.
Sources of Epidemiological Data in India
Epidemiology is only as strong as its data. In India, epidemiological data flow from multiple overlapping systems, each with distinct coverage, completeness, and purpose. Understanding which source answers which question — and where each source falls short — is a core practical skill for community medicine practitioners.
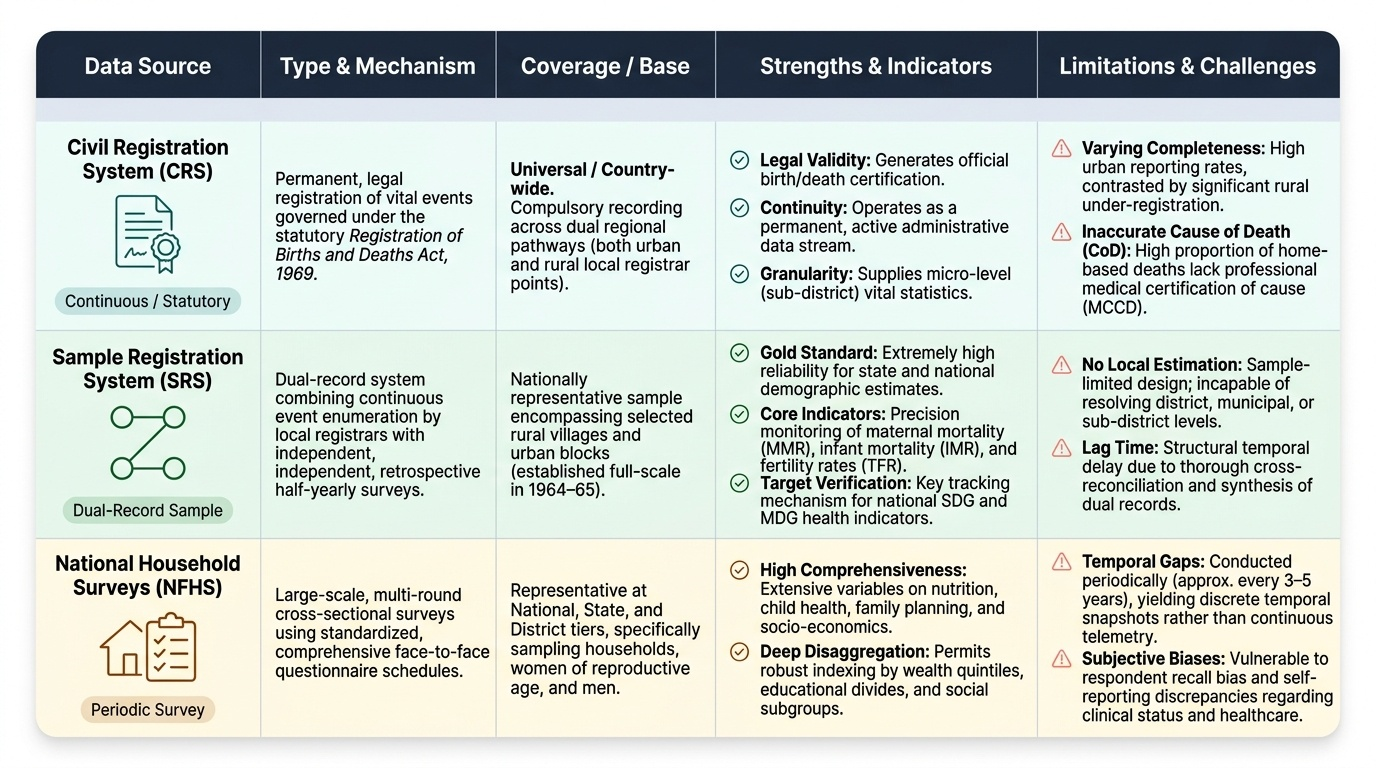
The Civil Registration System (CRS) is India's statutory mechanism for registering births and deaths under the Registration of Births and Deaths Act, 1969. Births and deaths must be reported to the local Registrar within a prescribed period. The CRS generates vital statistics — birth rates, death rates, causes of death — that are foundational for life tables and programme evaluation. However, CRS completeness varies: urban registration is higher than rural; cause-of-death attribution is often inaccurate because most rural deaths occur at home without medical certification.
The Sample Registration System (SRS), established by the Registrar General of India in 1964-65 on a full scale, is a dual-record system that operates in a nationally representative sample of villages and urban blocks. Civil registrars and independent surveyors record events independently; discrepancies are reconciled through half-yearly surveys. The SRS produces the most reliable estimates of fertility rates (total fertility rate, general fertility rate) and mortality rates (crude death rate, infant mortality rate, maternal mortality ratio) at national and state levels. It is the primary source for tracking MDG/SDG demographic targets.
National household surveys — principally the National Family Health Survey (NFHS) and the National Sample Survey (NSS) — provide data on health behaviours, service utilisation, morbidity prevalence, and socioeconomic determinants that administrative systems cannot capture. NFHS (now in its 5th round, 2019-21) covers reproductive, maternal, newborn, child, and adolescent health plus nutrition and domestic violence. NSS rounds on health (e.g. NSS 75th round, 2017-18) estimate morbidity rates, hospitalisation rates, and out-of-pocket expenditure.
Disease notification systems operate under central and state public health legislation. Notifiable diseases — including cholera, plague, yellow fever (internationally under IHR 2005), plus state-specific lists (typhoid, malaria, dengue) — must be reported from hospitals and laboratories to district health authorities, who aggregate upward to the state and national Integrated Disease Surveillance Programme (IDSP). IDSP uses a syndrome-based reporting structure (P, L, S forms for community, laboratory, and clinical reporters) enabling rapid outbreak detection.
Hospital records, cancer registries, and disease-specific registers provide secondary data for specific conditions. The Population-Based Cancer Registry (PBCR) network (part of the National Cancer Registry Programme) collects incidence data from defined geographic areas. TB is tracked through Nikshay (India's case-based notification portal). These registries enable incidence estimation and trend monitoring for conditions under-represented in general vital statistics.
Sentinel surveillance sites — strategically selected hospitals or clinics — monitor trends in conditions like HIV (sentinel antenatal care surveillance), influenza (sentinel ILI/SARI sites), and antimicrobial resistance, generating timely trend data without the cost of universal surveillance.
Provided image
SELF-CHECK
The Sample Registration System (SRS) uses a dual-record method. What is the primary purpose of this dual-record design?
A. To double the sample size and improve precision
B. To reconcile independently recorded events and estimate completeness of registration
C. To allow simultaneous urban and rural data collection by two agencies
D. To record both births and deaths in the same survey instrument
Reveal Answer
Answer: B. To reconcile independently recorded events and estimate completeness of registration
The SRS dual-record system pairs continuous registration by a part-time enumerator with retrospective recall surveys by an independent supervisor. When the two records are matched, unmatched events in each record reveal under-reporting; this allows estimation of completeness and correction of birth/death rates. The design is specifically about validity/completeness estimation — not merely doubling sample size.