Page 13 of 25
CM1.7-8 | CM1.7-8 | Health Indicators and Demographic Profile — SDL Guide
Learning Objectives
- Define and enumerate the major categories of health indicators
- State the exact numerator, denominator, and per-N multiplier for IMR, NMR, PNMR, MMR, U5MR, CDR, CBR, TFR, and LEB
- Explain the difference between a mortality rate and the Maternal Mortality Ratio
- Describe India's demographic profile using key data from Census 2011 and NFHS-5 (2019-21)
- Explain demographic transition and its current stage in India
- Discuss the impact of India's demographic profile on health planning and service needs
INSTRUCTIONS
Health indicators are the language in which populations speak about their health. Without them, a community physician cannot compare health status across districts, track progress toward national targets, or identify which programme deserves priority investment. This module builds precise literacy in the definitions and denominators of major health indicators — a skill that is both clinically important (interpreting district data) and a consistent examination topic. It pairs each indicator with India's current reality through Census 2011 and NFHS-5 data, grounding the definitions in the country's actual demographic situation.
References
- Park's Textbook of Preventive and Social Medicine, 26th edition — Ch on Health Indicators and Demography (textbook)
- National Family Health Survey 5 (NFHS-5), 2019-21, IIPS Mumbai — key indicators for India (document)
- Sample Registration System Statistical Report — annual vital rates for India (document)
Version 2.0 | NMC CBUC 2024
CLINICAL SCENARIO
Two neighbouring districts in the same Indian state — similar geography, similar ethnicity, similar climate. Yet District A has an Infant Mortality Rate of 18 per 1,000 live births, while District B's IMR is 52. In District A, 92% of deliveries occur in institutions; in District B, only 54%. The Maternal Mortality Ratio of District A is 67 per 100,000 live births; District B's is 340. These numbers are not just statistics — they represent thousands of preventable deaths. The district health officer of District B who cannot read and interpret these indicators will not know where to deploy nurses, which programme to intensify, or how to make the case for additional resources to the state government. Health indicators are the decision tools of community medicine.
WHY THIS MATTERS
Every health programme in India — from the Universal Immunisation Programme to the Pradhan Mantri Surakshit Matritva Abhiyan — is designed, monitored, and evaluated using health indicators. The national targets set under the Sustainable Development Goals (SDGs) are expressed as specific indicator values to be achieved by 2030 (e.g., MMR <70 per 100,000 live births, U5MR <25 per 1,000 live births). As a medical officer in a Primary Health Centre or Community Health Centre, you will be required to report indicator-based data to district authorities, to justify resource requests using indicator evidence, and to explain to communities what the numbers mean for their health. Indicator literacy is not optional — it is a core competency of community medicine practice.
RECALL
You have already learned about health measurement in the context of levels of prevention (CM1.5) — where reducing incidence and mortality rates are the metrics for primary and secondary prevention success, respectively. You also encountered the SRS and NFHS-5 as India's primary health data sources in the earlier module on definitions of health (CM1.2). This module builds on those foundations by defining each indicator precisely — numerator, denominator, and per-N multiplier — and by contextualising them within India's actual demographic situation. As you read, keep the 'measurement → monitoring → management' chain in mind: indicators exist to serve decision-making, not as ends in themselves.
Why Health Indicators Matter — Measuring the Burden
A health indicator is a quantifiable characteristic that reflects the health status of a population and can be used to compare populations, track trends over time, evaluate the impact of interventions, and identify priority areas for action. Without indicators, health planning would be based on anecdote and impression — which districts appear unhealthy, which populations seem to suffer more — rather than on systematically collected, comparable evidence. The development of standardised health indicators was one of the most important methodological advances in public health in the 20th century.
Health indicators can be classified into several broad categories, each measuring a different dimension of population health:
- Mortality indicators: measure premature death — the most extreme adverse health outcome. Examples: Crude Death Rate (CDR), Age-Specific Death Rate (ASDR), Infant Mortality Rate (IMR), Maternal Mortality Ratio (MMR), Under-5 Mortality Rate (U5MR).
- Morbidity indicators: measure disease burden — how much illness exists in the population. Examples: incidence rate, prevalence rate, attack rate.
- Positive health indicators: measure the presence of good health and functional capacity, not just the absence of death or disease. Examples: Life Expectancy at Birth (LEB), Healthy Life Expectancy (HALE), Disability-Adjusted Life Years (DALYs).
- Disability indicators: measure the burden of non-fatal disease consequences. Examples: DALYs, Years Lived with Disability (YLD), Years of Life Lost (YLL).
- Socioeconomic and health-service indicators: measure structural determinants and system capacity. Examples: literacy rate, per-capita income, sex ratio, doctor-to-population ratio, proportion of institutional deliveries.
No single indicator fully captures a population's health — a comprehensive profile requires indicators from multiple categories, selected to match the specific health questions being asked.
Mortality Indicators — Definitions, Denominators and Interpretation
Mortality indicators are the most widely used health indicators because deaths are recorded more reliably than morbidity, and because premature mortality represents the most severe measure of population health failure. However, each mortality indicator has a specific numerator, denominator, and per-N multiplier — and confusing these, especially for IMR and MMR, is among the most common examination errors.
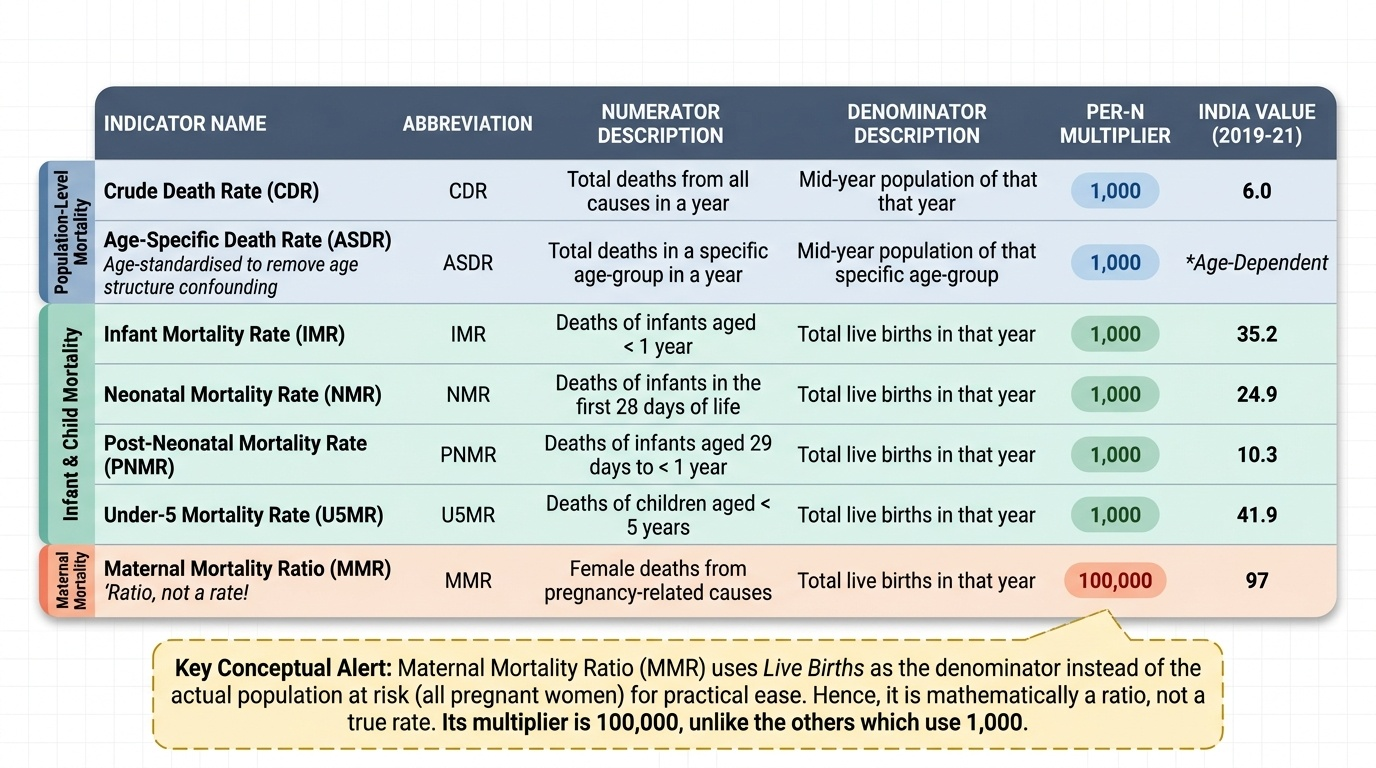
Crude Death Rate (CDR): Total deaths from all causes per 1,000 mid-year population per year. 'Crude' means unadjusted for age — it reflects the raw mortality in the population but is influenced by the age structure (an ageing population has a higher CDR even if health is improving). CDR is useful for population-level tracking but not for valid international comparison.
Age-Standardised (or Age-Specific) Death Rate (ASDR): Deaths in a specific age group per 1,000 persons in that age group per year. Age-standardisation removes the confounding effect of different age structures, allowing valid comparisons across populations.
Infant Mortality Rate (IMR): Deaths of infants aged less than 1 year per 1,000 live births in a given year. IMR is subdivided into: Neonatal Mortality Rate (NMR) — deaths in the first 28 days of life per 1,000 live births; and Post-Neonatal Mortality Rate (PNMR) — deaths from 29 days to less than 1 year per 1,000 live births. Mathematically: IMR = NMR + PNMR. IMR is widely considered one of the most sensitive indicators of overall socioeconomic development and health system quality.
Under-5 Mortality Rate (U5MR): Deaths of children aged less than 5 years per 1,000 live births per year. U5MR is higher than IMR (it includes all deaths up to age 5) and is particularly sensitive to child nutrition, vaccination coverage, and management of childhood illness.
Maternal Mortality Ratio (MMR): Maternal deaths (deaths of women during pregnancy, childbirth, or within 42 days of termination of pregnancy from causes related to or aggravated by pregnancy) per 100,000 live births per year. Crucially, MMR is technically a ratio, not a rate — its denominator (live births) is not the at-risk population (all pregnant women), but live births are used as a practical proxy. A true maternal mortality rate would use woman-years of exposure, which is rarely available. The denominator is 100,000 live births — not 1,000, not total women — and this distinction is the most frequently tested denominator in community medicine examinations.
Provided image
Proportional Mortality Rate (PMR): The proportion of all deaths attributable to a specific cause; useful for identifying leading causes of death in a population.
SELF-CHECK
The Maternal Mortality Ratio (MMR) for a district is calculated using which denominator?
A. 1,000 live births
B. 1,000 total births (live + still)
C. 100,000 live births
D. 100,000 women of reproductive age (15-49 years)
Reveal Answer
Answer: C. 100,000 live births
The MMR uses 100,000 live births as the denominator — not 1,000, not total births, and not the actual at-risk population of pregnant women. Because the denominator is live births (not woman-years of exposure), MMR is technically a ratio, not a rate. This is the most commonly tested denominator in Community Medicine. India's MMR per SRS 2018-20 was 97 per 100,000 live births, the latest available national estimate.
Fertility, Morbidity, and Positive Health Indicators
Beyond mortality, health indicators encompass fertility (population replacement and growth), morbidity (disease burden), and positive dimensions of health (well-being and capacity).
Fertility indicators:
- Crude Birth Rate (CBR): Total live births per 1,000 mid-year population per year. 'Crude' because the denominator includes males and children, not just fertile women.
- General Fertility Rate (GFR): Live births per 1,000 women aged 15–44 (or 15–49) per year. More specific than CBR — the denominator is the relevant female population.
- Total Fertility Rate (TFR): The average number of children a woman would have if she experienced the current age-specific fertility rates throughout her reproductive life (15–49 years). TFR is the key indicator for population replacement: TFR ≈ 2.1 is the replacement level (slightly above 2.0 to account for sex ratio at birth and female mortality before completing reproduction). India's TFR per NFHS-5 (2019-21) is 2.0, indicating that India has crossed below replacement level fertility nationally, though variation remains high between states.
Morbidity indicators:
- Incidence rate: New cases of a disease arising in a defined population per unit time per 1,000 (or 100,000) population at risk. Measures how fast new disease is occurring.
- Prevalence rate: All existing cases (new + old) of a disease in a defined population at a point in time (point prevalence) or over a defined period (period prevalence), expressed per 1,000 (or 100,000) population.
- Attack rate: The incidence rate during an epidemic or outbreak, expressed as the proportion of the exposed population that develops disease during the outbreak period. Used in communicable disease epidemiology.
Positive and disability indicators:
- Life Expectancy at Birth (LEB): The average number of years a newborn would live if current age-specific mortality rates remained constant throughout their life. Increases as mortality falls. India's LEB has risen from 32 years at independence to approximately 70 years (SRS-based estimates).
- Healthy Life Expectancy (HALE): Life expectancy adjusted for time lived in less-than-full health — years in full health. A more meaningful measure of quality-adjusted survival.
- Disability-Adjusted Life Year (DALY): One DALY = one year of healthy life lost, calculated as: DALY = YLL + YLD, where YLL (Years of Life Lost) measures premature mortality (years lost due to dying before the standard life expectancy) and YLD (Years Lived with Disability) measures time lived with a disability weighted by its severity. DALYs are the primary measure of disease burden used in global comparative analyses.
| Indicator type | Indicator | Formula | Unit |
|---|---|---|---|
| Fertility | CBR | Live births / mid-year population | Per 1,000 |
| Fertility | TFR | Sum of age-specific fertility rates × 5 | Children per woman |
| Morbidity | Incidence rate | New cases / population at risk | Per 1,000 or 100,000 |
| Morbidity | Prevalence rate | Existing cases / population | Per 1,000 or 100,000 |
| Positive | LEB | Derived from age-specific mortality table | Years |
| Disability | DALY | YLL + YLD | Years of healthy life lost |