Page 5 of 16
CM16.3 | CM16.3 | Health Management Techniques — SDL Guide (Part 2)
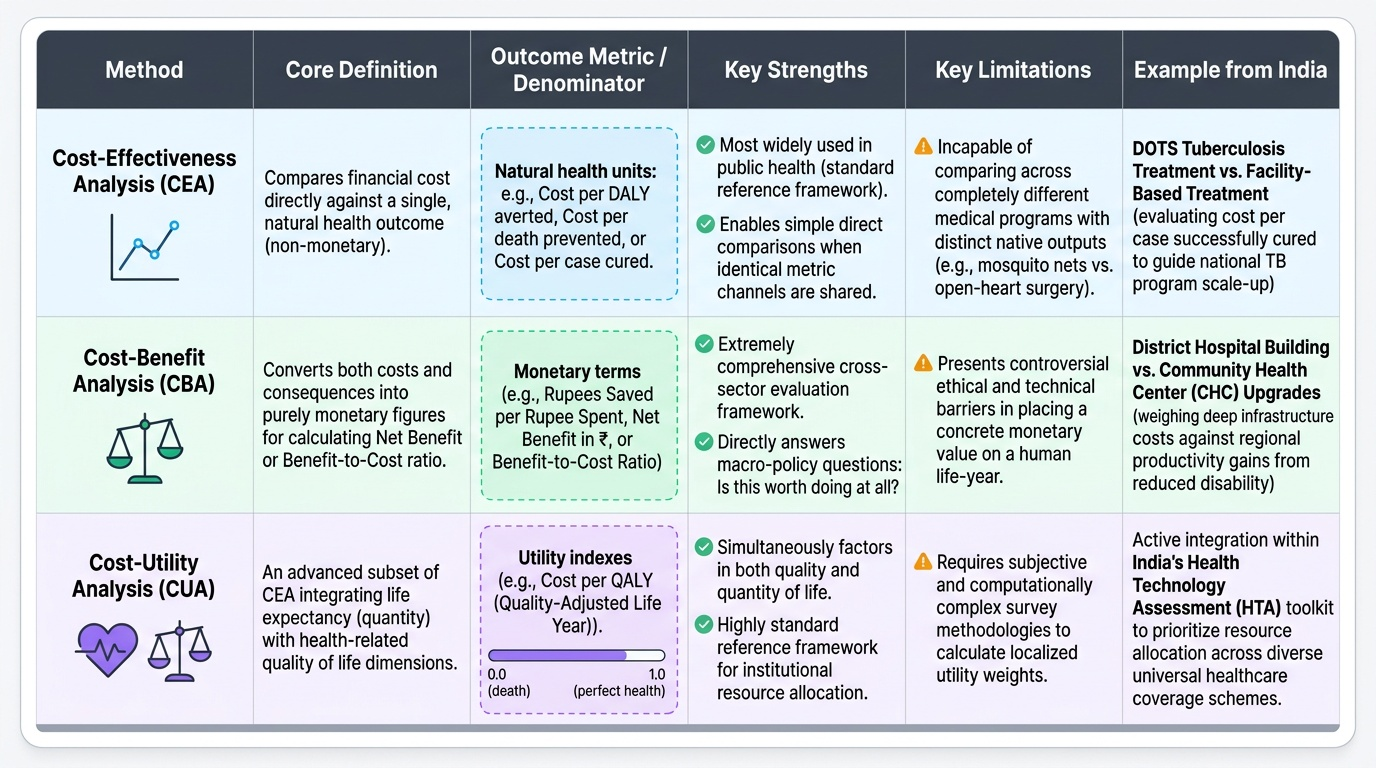
Health Economics Tools: Cost-Effectiveness, Cost-Benefit, and Cost-Utility Analysis
Health economics analytical methods are management tools for priority-setting and resource allocation — they answer the question: 'Of the multiple interventions we could fund, which delivers the greatest health value per rupee?' For a district health manager with a finite budget and multiple competing programme demands, these analyses provide the evidence base for rational allocation.
Cost-Effectiveness Analysis (CEA) compares the costs of an intervention against a single, programme-specific health outcome — typically expressed as cost per DALY averted, cost per death prevented, or cost per case detected and treated. Because the outcome is in natural health units (not money), CEA allows comparison across programmes only when the same outcome metric is used. A WHO benchmark for the traditional cost-effectiveness threshold is 1-3× per capita GDP per DALY averted (though this is being revisited with more country-specific thresholds). CEA is the most widely used economic evaluation method in public health, applied to vaccine introduction decisions, TB programme comparisons, and malaria control strategy choices in India. Example: comparing the cost-effectiveness of DOTS vs facility-based TB treatment shows both cost per case cured and guides scale-up decisions.
Cost-Benefit Analysis (CBA) converts all costs AND benefits into monetary terms, allowing a net benefit (benefit minus cost) or a benefit-to-cost ratio to be calculated. This is more comprehensive than CEA but requires monetising health outcomes — a technically and ethically challenging step (what is the monetary value of a life-year?). CBA is more commonly used for large infrastructure decisions (building a new district hospital vs upgrading CHCs — weighing construction cost against economic productivity gains from reduced disability) or for policy-level analyses. It answers: 'Is this programme economically worth doing?' rather than 'Which programme is more efficient at achieving a health outcome?'
Cost-Utility Analysis (CUA) uses Quality-Adjusted Life Years (QALYs) as the outcome measure — combining life years gained with a quality-of-life weight (0=death, 1=perfect health). It is the standard economic evaluation method in high-income countries and is being adopted for India's HTA (Health Technology Assessment) framework. CUA is particularly useful for comparing interventions with very different types of health benefit (e.g., cataract surgery that restores vision vs chemotherapy that extends life with impaired quality). The National Health Technology Assessment Resource Centre (HTAIn) in India now uses CUA as a standard for evaluating new health technologies for inclusion under PM-JAY.
Provided image
Quality Improvement Tools: TQM and the PDSA Cycle
Quality improvement tools address a specific management challenge: how do you systematically identify and correct deficiencies in health service delivery at the facility or programme level? Two related frameworks are central: Total Quality Management (TQM) and the PDSA cycle.
Total Quality Management (TQM) is an organisation-wide philosophy and approach to continuous quality improvement. It emerged from industrial quality management (Deming, Juran, Crosby) and was adopted in health care from the 1980s onward. The core TQM principles relevant to health systems are: (1) customer focus — the patient is the primary customer, and all quality improvement aims to meet or exceed patient expectations; (2) continuous improvement — quality is not a one-time target but an ongoing process of incremental betterment; (3) employee involvement — quality improvement requires participation from all staff, not just managers; (4) process orientation — problems are rooted in systems and processes, not in individual blame; and (5) evidence-based decision-making — using data to identify problems and measure improvement.
The PDSA cycle (Plan-Do-Study-Act), also called the Deming cycle or Shewhart cycle after its originators, is the operational quality improvement tool within TQM. It operates as a rapid-cycle improvement method:
- Plan: Identify a quality problem, collect baseline data, hypothesise a solution, and plan a small-scale test.
- Do: Implement the planned change on a small scale (e.g., test a new patient-registration process in one PHC for one month).
- Study: Collect data on the change's effect; compare to baseline. Did the change improve the quality indicator?
- Act: If the change worked, standardise and scale it. If it did not work, revise the hypothesis and begin the next PDSA cycle.
In India's public health system, TQM principles are applied through the Kayakalp programme (launched 2015 by MoHFW), which provides quality certification and cash awards to public health facilities that meet defined quality standards across six domains: hospital upkeep, sanitation, hygiene, infection control, support services, and clinical services. Facilities conduct self-assessment, followed by peer assessment and national verification. Kayakalp uses the PDSA logic: the self-assessment identifies gaps (Plan), facilities implement improvements (Do), the peer review measures change (Study), and certification or further improvement follows (Act).
SELF-CHECK
A PHC team identifies that the average waiting time for OPD patients has increased from 35 minutes to 65 minutes over three months. They hypothesise that the bottleneck is the single registration counter and pilot a new dual-counter system for two weeks, measuring waiting time daily. After two weeks, average waiting time has fallen to 38 minutes. According to the PDSA cycle, what is the correct next step?
A. Plan: collect more baseline data before making any changes permanent
B. Study: the two-week pilot IS the Study phase — now Act by standardising the dual-counter system and scaling if resources allow
C. Do: extend the pilot for another three months to be certain of the result
D. Act: immediately expand dual counters to all CHCs in the district without further testing
Reveal Answer
Answer: B. Study: the two-week pilot IS the Study phase — now Act by standardising the dual-counter system and scaling if resources allow
The PDSA cycle position here is: Plan (identified problem, designed the dual-counter test), Do (implemented for two weeks), and now Study (data shows waiting time fell from 65 to 38 minutes — close to baseline). Since the intervention achieved its goal, the correct next step is Act — standardise the dual-counter system at this PHC and scale it to similar-capacity facilities after assessing resource requirements. Collecting more baseline data (option A) would re-run Plan unnecessarily. Extending the pilot for three more months (option C) is appropriate only if the Study phase result was inconclusive — here the result is clear. Immediately expanding to all CHCs without further testing (option D) skips the scaling verification step — each new site should run its own small-scale PDSA to confirm the same solution works in its context.
Evaluating and Selecting Management Techniques in Practice
A district health manager does not choose management techniques in the abstract; they choose them in response to a specific management problem under specific constraints. The M&E phase of the planning cycle generates the data that identifies which management problem needs attention, and the management technique is the response. Understanding how to evaluate and select from the available toolkit is therefore an essential skill.
The primary monitoring tools in India's public health system are the HMIS (Health Management Information System), accessible at block/district/state/national levels with monthly facility-reported data, and the MCTS/RCH portal for individual-level maternal and child health tracking. These are routine monitoring tools — they generate the management information needed to identify deviations from plan. Supplementing routine HMIS, supervisory tools include: (a) structured supervision checklists (standardised tools that supervisors complete during facility visits — MoHFW provides standard formats for PHC/CHC supervision); (b) community scorecards (participatory monitoring tools where community members assess health facility performance against standards — adopted in some NHM districts); and (c) facility surveys (periodic structured assessments of facility readiness, used in NRHM's facility assessment rounds).
When selecting a management technique, the health manager applies a practical decision framework: (1) What is the specific management problem? (scheduling delay, quality deficiency, resource wastage, data quality, human resource gap) — the problem type suggests the technique category. (2) What data is available? (techniques requiring cost-utility data cannot be applied where QoL data does not exist). (3) What is the management capacity at this level? (PERT/CPM requires analytical capacity not available at sub-centre level; Gantt chart is universally usable). (4) What is the time horizon? (PDSA cycles work for rapid 2-4 week improvement tests; logframes are designed for 3-5 year programme lifecycles). Matching technique to problem, data, capacity, and time horizon — rather than applying a favoured tool to every problem — is the hallmark of effective health management.