Page 4 of 17
IM23.8-12 | Acid Base Disorders and ABG Interpretation — SDL Guide
Learning Objectives
- Enumerate the causes and describe the clinical and laboratory features of metabolic acidosis, metabolic alkalosis, respiratory acidosis, and respiratory alkalosis
- Apply the six-step ABG interpretation framework to identify the primary disorder, assess compensation, calculate the anion gap, apply Winter's formula, and compute the delta-delta ratio
- Identify mixed acid-base disorders from an ABG and correlate with the clinical context
- Discuss the management principles for common acid-base disturbances
INSTRUCTIONS
Acid-base analysis is one of the most powerful diagnostic tools in medicine, capable of identifying metabolic, respiratory, renal, and toxic processes from a single blood gas result. This module establishes the normal physiology of acid-base balance, then builds through each of the four primary disorders systematically, and culminates in the six-step ABG interpretation framework that allows you to identify primary disorders, their compensation, and mixed patterns at the bedside.
References
- Harrison's Principles of Internal Medicine, 21st ed., Ch. 49 — Fluid and Electrolyte Disturbances and Acid-Base Disorders (textbook)
- API Textbook of Medicine, 10th ed. — Acid-Base Disorders (textbook)
- Davidson's Principles and Practice of Medicine, 24th ed., Ch. 19 — Acid-Base Disturbances (textbook)
Version 2.0 | NMC CBUC 2024
CLINICAL SCENARIO
You are called at 2 AM to a 58-year-old diabetic man brought in confused and tachypnoeic. His blood gas result arrives: pH 7.18, PaCO₂ 18 mmHg, HCO₃⁻ 7 mmol/L, Na 138, Cl 98, K 5.2, glucose 42 mmol/L, lactate 1.1 mmol/L. Two minutes later, an ECG shows sinus tachycardia with peaked T waves.
Four questions need answers simultaneously:
1. What is the primary acid-base disorder?
2. Is compensation appropriate — or is there a second disorder?
3. What is the anion gap, and does it fit?
4. What does the delta-delta tell you about a hidden third disorder?
Without a structured approach, you will miss the mixed pattern. Without calculating Winter's formula, you may overlook a coexisting respiratory acidosis. Without the delta-delta, you might miss a concurrent normal-anion-gap acidosis from bicarbonate loss. The six-step ABG interpretation framework gives you all of this in under two minutes at the bedside — but only if it is automatic. This module builds that automaticity from physiological first principles.
WHY THIS MATTERS
ABG interpretation is a mandatory skill for every physician, not just intensivists. In the emergency department, ward, and ICU alike, acid-base disorders signal the severity of the underlying disease and guide immediate management: is this septic shock patient adequately ventilated? Is the diabetic ketoacidosis responding to insulin? Is the patient with COPD in acute hypercapnic failure? For NMC competencies IM23.8–23.12, you must be able to enumerate causes, describe laboratory features, and — critically for IM23.12 — identify the underlying acid-base disorder from an actual ABG result interpreted in clinical context. This is an applied skill that requires repeated practice on worked examples, and this module provides both the framework and the scenarios.
RECALL
Activate prior knowledge of buffer systems and respiratory physiology. The body's pH is maintained between 7.35 and 7.45 (equivalent to an H⁺ concentration of 35–45 nmol/L). The two major buffer systems are: (1) the bicarbonate-carbonic acid system — the most physiologically important; CO₂ dissolved in blood forms carbonic acid (H₂CO₃), which dissociates to H⁺ + HCO₃⁻. The relationship is described by the Henderson-Hasselbalch equation: pH = pKa + log([HCO₃⁻] / [H₂CO₃]), or in practical terms: pH = 6.1 + log([HCO₃⁻] / (PaCO₂ × 0.03)). This means pH is determined by the ratio of HCO₃⁻ to PaCO₂ — which is why changes in either the metabolic (HCO₃⁻) or respiratory (PaCO₂) axis shift pH. Normal values: pH 7.35–7.45; PaCO₂ 35–45 mmHg; HCO₃⁻ 22–26 mmol/L; base excess −2 to +2 mEq/L. (2) Intracellular and protein buffers — haemoglobin, phosphate, and other proteins handle about 50% of buffering acutely. Recall also that compensation is a secondary response by the opposite system — respiratory disorders are compensated metabolically (kidneys adjust HCO₃⁻), and metabolic disorders are compensated respiratorily (lungs adjust PaCO₂). Compensation moves pH toward normal but NEVER fully corrects it; a fully normal pH in the presence of abnormal PaCO₂ and HCO₃⁻ always means a mixed disorder or a different primary problem.
Orientation: Why ABG Interpretation Requires a Structured Approach
Acid-base physiology governs the function of every enzyme, receptor, and ion channel in the human body. A pH below 7.20 impairs cardiac contractility and reduces the responsiveness of catecholamine receptors, directly threatening haemodynamic stability. A pH above 7.60 causes neuromuscular irritability, tetany, and cardiac arrhythmias. Even minor derangements — a metabolic acidosis with pH 7.30 — signal underlying pathology in multiple possible organ systems: the lungs are not the only cause of acidaemia, nor is the kidney the only buffer. Understanding how to read an arterial blood gas (ABG) systematically is therefore not simply a technical skill but a clinical reasoning exercise that integrates physiology, pathology, and history in a structured sequence.
The most common clinical error in ABG interpretation is to look only at the pH and label the patient as 'acidotic' or 'alkalotic' without identifying the primary disorder, assessing whether compensation is appropriate, or considering the possibility of a mixed disorder. A pH of 7.38 — squarely in the normal range — can conceal two simultaneous opposing disorders that are exactly cancelling each other: for example, a metabolic alkalosis from vomiting and a metabolic acidosis from renal failure, both present, both significant, both requiring treatment. Only a structured six-step approach reveals this.
The four primary acid-base disorders are: metabolic acidosis (low HCO₃⁻ drives pH down), metabolic alkalosis (high HCO₃⁻ drives pH up), respiratory acidosis (high PaCO₂ drives pH down), and respiratory alkalosis (low PaCO₂ drives pH up). Each has a characteristic set of causes, each triggers a predictable compensatory response from the opposite system, and each has a management approach that targets the root cause. The six-step framework interrogates these four disorders systematically, and its power comes from applying it in order — skipping steps leads to missed mixed disorders.
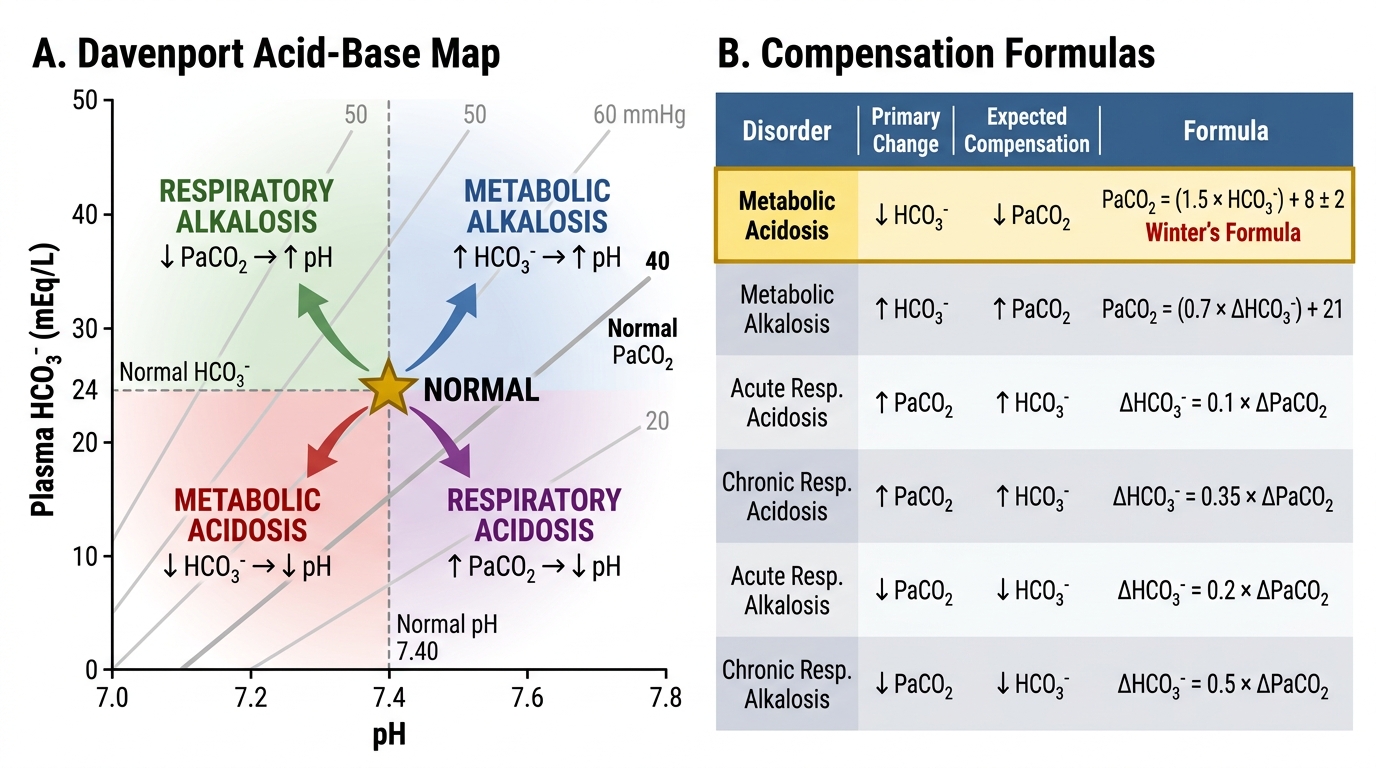
Davenport Acid-Base Map and Compensation Formulas
Normal Acid-Base Balance: Buffers, Compensation, and Reference Values
The body generates approximately 15,000 mmol of CO₂ per day from aerobic metabolism and 50–100 mEq of fixed (non-volatile) acid (primarily sulphuric acid from protein catabolism and phosphoric acid from phospholipid metabolism) — all of which must be continuously buffered and eliminated. The bicarbonate system is the dominant extracellular buffer because: (1) its components — CO₂ and HCO₃⁻ — are independently regulated (CO₂ by ventilation, HCO₃⁻ by the kidney); (2) it is present in high concentration; and (3) it buffers over a wide pH range relevant to physiology.
Provided image
The Henderson-Hasselbalch equation in clinical form: pH = 6.1 + log(HCO₃⁻ / (PaCO₂ × 0.03)). At normal values: pH = 6.1 + log(24 / (40 × 0.03)) = 6.1 + log(24 / 1.2) = 6.1 + log(20) = 6.1 + 1.30 = 7.40. The ratio of HCO₃⁻ to (PaCO₂ × 0.03) is normally 20:1 — this is the key insight for understanding why any change in either numerator or denominator shifts pH.
Renal regulation of HCO₃⁻: The kidney reclaims approximately 4500 mEq of filtered HCO₃⁻ per day in the proximal tubule via H⁺ secretion coupled to Na⁺/H⁺ exchange (NHE3). The kidney also generates new HCO₃⁻ by excreting H⁺ as ammonium (NH₄⁺, the dominant pathway, accounting for approximately 40–70 mEq/day) and as titratable acid (primarily H₂PO₄⁻, approximately 10–40 mEq/day). In metabolic acidosis, the kidney responds by increasing NH₄⁺ production (glutamine → glutamate → α-ketoglutarate pathway), which regenerates bicarbonate; this response is full at 3–5 days. In metabolic alkalosis, the kidney reduces H⁺ secretion and allows HCO₃⁻ to be excreted — but this capacity is limited when volume depletion is present (chloride depletion maintains alkalosis by forcing continued H⁺ secretion to retain Na⁺).
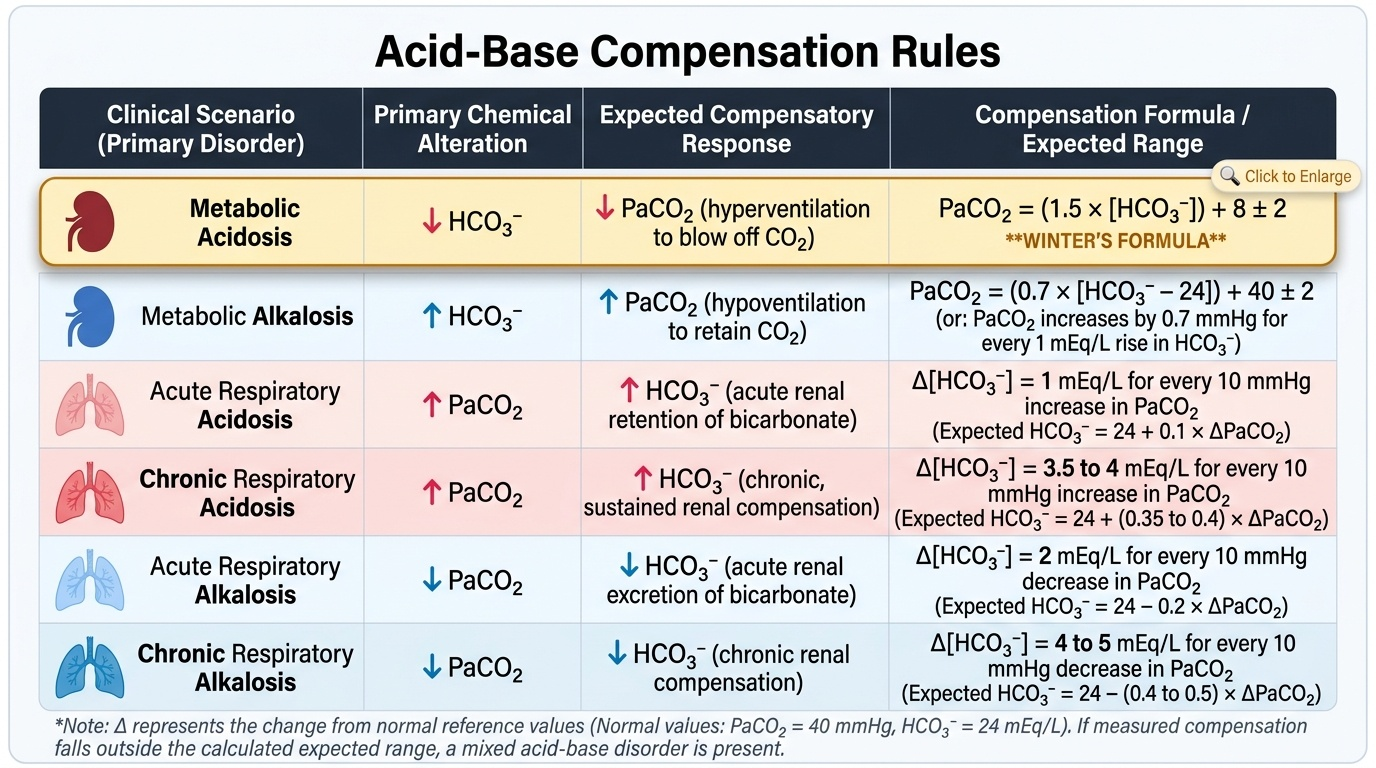
Compensation rules — the expected responses: These formulas predict the appropriate secondary response for each primary disorder. If the measured compensation differs from the expected range, a second primary disorder is present:
| Primary Disorder | Expected Compensation Formula |
|---|---|
| Metabolic acidosis | PaCO₂ = 1.5 × HCO₃⁻ + 8 ± 2 (Winter's formula) |
| Metabolic alkalosis | PaCO₂ increases by 0.7 × (HCO₃⁻ − 24) mmHg |
| Respiratory acidosis (acute) | HCO₃⁻ increases by 1 mmol/L per 10 mmHg rise in PaCO₂ |
| Respiratory acidosis (chronic) | HCO₃⁻ increases by 3.5 mmol/L per 10 mmHg rise in PaCO₂ |
| Respiratory alkalosis (acute) | HCO₃⁻ decreases by 2 mmol/L per 10 mmHg fall in PaCO₂ |
| Respiratory alkalosis (chronic) | HCO₃⁻ decreases by 5 mmol/L per 10 mmHg fall in PaCO₂ |
Winter's formula is the single most important compensation formula to memorise for the exam and for practice. Applied to metabolic acidosis: expected PaCO₂ = 1.5 × HCO₃⁻ + 8 ± 2. If measured PaCO₂ is HIGHER than expected → concurrent respiratory acidosis. If measured PaCO₂ is LOWER than expected → concurrent respiratory alkalosis. Example: HCO₃⁻ = 12 → expected PaCO₂ = 1.5 × 12 + 8 = 26 ± 2 (i.e., 24–28). If measured PaCO₂ = 20 → respiratory alkalosis is also present.
Metabolic Acidosis: Causes, Anion Gap, and Delta-Delta
Metabolic acidosis is characterised by a primary fall in serum bicarbonate (HCO₃⁻ <22 mmol/L), driving pH below 7.35. The single most powerful tool for narrowing its cause is the anion gap (AG), calculated as: AG = Na⁺ − (Cl⁻ + HCO₃⁻). Normal AG = 8–12 mEq/L (some laboratories use 12 ± 2 depending on the albumin assay). The AG represents unmeasured anions (primarily albumin, phosphate, sulphate, and organic anions). When acidosis is generated by accumulation of an organic acid (e.g., lactate, ketones, uraemic anions), the acid consumes HCO₃⁻ and leaves its conjugate anion unmeasured — the gap widens. When acidosis is generated by loss of HCO₃⁻ or gain of chloride, no new unmeasured anion is added and the gap remains normal (Cl⁻ rises to compensate — hence 'hyperchloraemic metabolic acidosis' or normal anion gap metabolic acidosis, NAGMA).
Always correct the anion gap for hypoalbuminaemia: for every 1 g/dL fall in albumin below 4 g/dL, the AG is underestimated by approximately 2.5 mEq/L. Corrected AG = measured AG + 2.5 × (4 − albumin g/dL). Failure to correct for hypoalbuminaemia is the most common cause of a missed high-AG acidosis.
The causes of metabolic acidosis are classified by anion gap:
High anion gap metabolic acidosis (HAGMA) — mnemonic MUDPILES: Methanol, Uraemia (CKD/AKI — sulphate, phosphate, hippurate), Diabetic ketoacidosis (and other ketoacidoses: alcoholic, starvation), Propylene glycol, Isoniazid/Iron, Lactic acidosis (most common cause — type A: tissue hypoperfusion/hypoxia [shock, cardiac arrest, mesenteric ischaemia]; type B: drugs [metformin, antiretrovirals], liver failure, malignancy, cyanide), Ethylene glycol (produces oxalate), Salicylates (aspirin overdose — also causes respiratory alkalosis by direct stimulation of the respiratory centre, creating a classically mixed picture).
Normal anion gap metabolic acidosis (NAGMA) — mnemonic HARD-UP or USED CARP: the essential categories are: (1) gastrointestinal bicarbonate loss — diarrhoea (most common), ileus, ileostomy, pancreatic fistula; (2) renal tubular acidosis (RTA) types 1, 2, 4; (3) hyperchloraemic saline infusion (iatrogenic — large-volume 0.9% NaCl administration replaces volume but adds chloride, dropping HCO₃⁻ by dilution and by inhibiting renal HCO₃⁻ regeneration); (4) Addison disease (hypoaldosteronism → type 4 RTA pattern); (5) acetazolamide (carbonic anhydrase inhibitor → reduces proximal tubular HCO₃⁻ reabsorption).
The urine anion gap (UAG = Na + K − Cl in urine) is the bedside test to distinguish diarrhoea (UAG negative, large NH₄⁺ excretion) from RTA (UAG positive, impaired NH₄⁺ excretion). In metabolic acidosis from diarrhoea, the kidney appropriately increases NH₄⁺ excretion; urine contains abundant NH₄⁺, which is measured as unmeasured cation, making the UAG negative. In RTA, the kidney fails to excrete NH₄⁺; urine Na + K exceeds Cl; UAG is positive.
The delta-delta ratio (DDR) = (measured AG − 12) / (24 − measured HCO₃⁻). This ratio compares the rise in AG to the fall in HCO₃⁻: if the rise in AG perfectly corresponds to the fall in HCO₃⁻, DDR = 1.0–2.0, indicating a pure HAGMA. If DDR <1.0: the HCO₃⁻ has fallen MORE than the AG rise — a concurrent NAGMA (e.g., DKA plus diarrhoea). If DDR >2.0: the HCO₃⁻ has fallen LESS than the AG rise — a concurrent metabolic alkalosis has raised the baseline HCO₃⁻, masking the degree of fall (e.g., DKA in a patient with pre-existing vomiting).
Clinical features of metabolic acidosis: deep, rapid, regular breathing — Kussmaul respiration (the compensatory hyperventilation blowing off CO₂); in severe cases this becomes an extreme gasping pattern. Nausea, vomiting, abdominal pain (especially in DKA). Peripheral vasodilation, reduced cardiac contractility, and hypotension in severe cases (pH <7.20). In DKA: fruity (ketone) breath odour. In uraemic acidosis: fatigue, anorexia, uraemic symptoms.
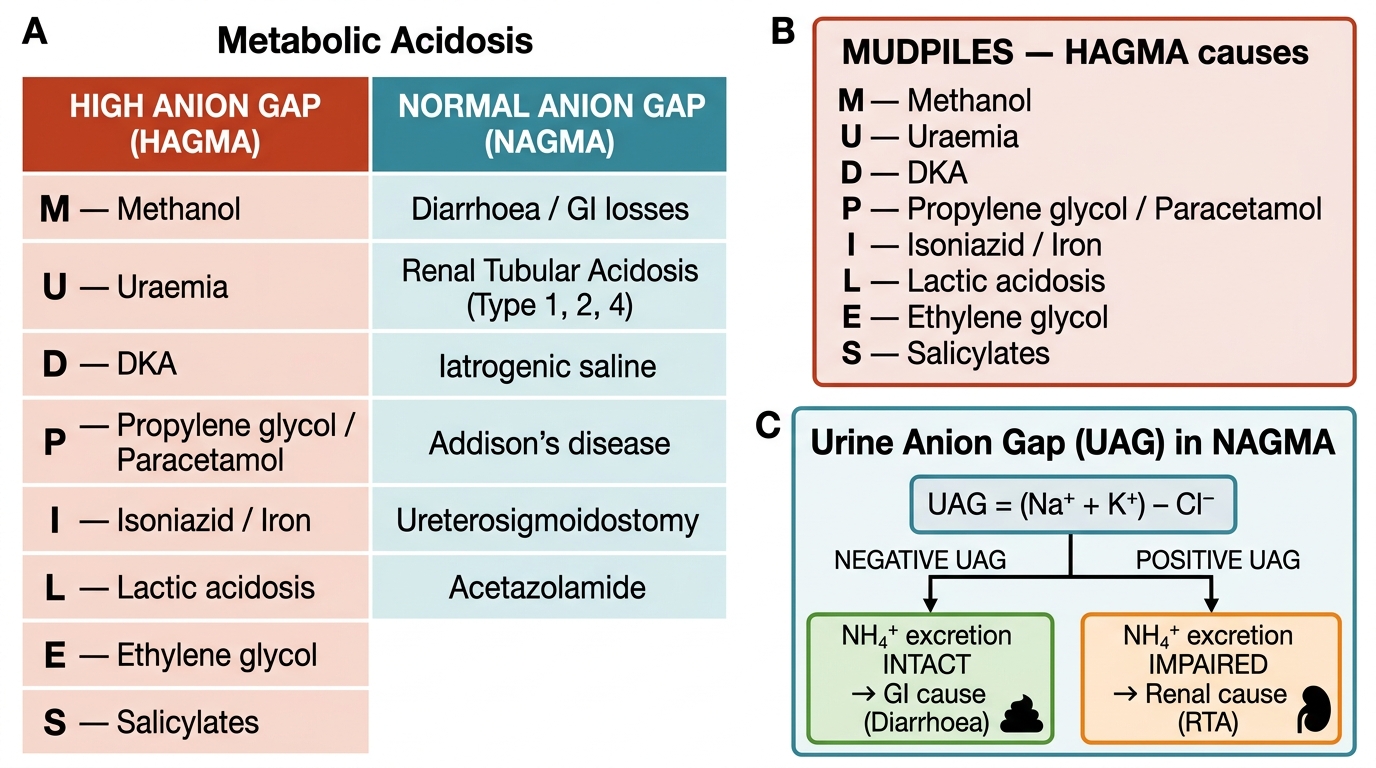
Metabolic Acidosis: HAGMA vs NAGMA — MUDPILES Mnemonic and Urine Anion Gap Interpretation