Page 9 of 48
PE27.3 | Meningitis Differentiation — SDL Guide
Learning Objectives
- Systematically interpret CSF findings to classify meningitis as bacterial, viral, tuberculous, or fungal
- Explain the pathophysiological basis for the distinctive CSF pattern of each meningitis category
- Identify diagnostic pitfalls including partially treated bacterial meningitis and early TBM
- Apply a step-by-step CSF interpretation method to worked clinical scenarios
INSTRUCTIONS
A child with suspected meningitis has had a lumbar puncture and the CSF report is in your hand. Your next action — which antibiotic, whether to add ATT, whether antifungals are needed — depends entirely on how accurately you interpret what you are reading. This module teaches you a systematic method for CSF interpretation, builds the pathophysiological understanding that makes the pattern memorable, and drills the key distinguishing features through worked examples. The comparison of bacterial, viral, and tuberculous meningitis (PE27.3) is a perennial high-yield topic in finals and an immediately applicable clinical skill.
References
- Ghai Essential Pediatrics, 9th ed., Ch 17 (CNS Infections) (textbook)
- Nelson Textbook of Pediatrics, 21st ed., Ch 616-617 (textbook)
- IAP Guidelines on Childhood Meningitis (guideline)
Version 2.0 | NMC CBUC 2024
CLINICAL SCENARIO
You are the intern on call. A 2-year-old child with 4 days of fever and 1 day of neck stiffness and irritability has just had a lumbar puncture. The CSF report arrives: appearance — clear; WBC 180/mm³ (75% lymphocytes, 25% neutrophils); protein 95 mg/dL; glucose 42 mg/dL (simultaneous serum glucose 88 mg/dL). The child received one dose of amoxicillin 36 hours ago from a local doctor. Is this bacterial meningitis that has been partially treated, viral meningitis, or early TBM? The answer will determine whether you give ceftriaxone and vancomycin, supportive care alone, or start ATT. You have 5 minutes to decide.
WHY THIS MATTERS
Meningitis differentiation is not an academic exercise — it is a decision that determines whether a child lives or dies, and whether treatment causes harm or benefit. Starting antibiotics for viral meningitis causes no direct harm but increases antibiotic resistance and prolongs hospitalisation. Failing to treat bacterial meningitis as viral costs lives and causes brain damage. Starting ATT in a child with viral meningitis carries hepatotoxicity risk and stigma. Failing to start ATT in TBM allows a preventable progression from Stage I to Stage II or III. Each diagnostic category demands a specific treatment; your ability to correctly classify the meningitis from the available CSF data is therefore one of the most consequential interpretive skills in paediatric medicine.
RECALL
Before proceeding, recall the following:
• Normal CSF values (from PY): WBC <5/mm³ (lymphocytes), protein 15–45 mg/dL, glucose 60–70% of simultaneous serum glucose, clear and colourless.
• Bacterial meningitis CSF (from PE27.1): turbid, neutrophilic pleocytosis (>80% PMN), ↑protein (>100 mg/dL), ↓glucose (ratio <0.40).
• TBM CSF (from PE27.2): clear/faintly turbid, lymphocytic, very high protein (often >100 mg/dL), low glucose, cobweb clot.
• Glucose ratio formula: CSF glucose ÷ simultaneous serum glucose; normal ratio = 0.60–0.70; ratio <0.40 = abnormally low.
• MRC staging of TBM: Stage I (alert, no deficit), Stage II (confused/focal), Stage III (coma/dense deficit).
Clinical Indication and Relevance of Meningitis Differentiation
Every child presenting with fever, headache, and meningeal signs undergoes lumbar puncture — the resulting CSF report is the primary tool for categorising the type of meningitis and directing treatment. The four major categories you must be able to distinguish are: bacterial (pyogenic) meningitis, viral (aseptic) meningitis, tuberculous meningitis, and fungal meningitis (primarily cryptococcal, in immunocompromised children). Each category has a pathophysiologically distinct mechanism of CSF inflammation, which produces a characteristic but not completely exclusive CSF profile. The word 'characteristic' is important: no individual CSF parameter is perfectly discriminatory, and several patterns overlap — which is precisely why a systematic, multi-parameter interpretation approach is essential rather than relying on any single number.
The clinical consequences of misclassification are concrete and serious. Bacterial meningitis misdiagnosed as viral results in a child being discharged without antibiotics, with a mortality risk of near-100% if untreated. TBM misdiagnosed as bacterial meningitis results in the correct antibiotic coverage for pyogenic organisms but no ATT — the TBM progresses relentlessly over the next weeks while the clinician wonders why the child is not improving. Fungal meningitis missed entirely is uniformly fatal in immunocompromised patients without antifungal therapy. Viral meningitis overtreated as bacterial leads to unnecessary antibiotic courses, hospital resources, and selection pressure for resistance.
The clinical context always frames CSF interpretation:
• Age of the child and vaccination status (determines organism likelihood for bacterial)
• Tempo of illness (acute hours–days = bacterial/viral; subacute weeks = TBM)
• Immune status (HIV, malnutrition, prolonged steroids = fungal risk)
• TB contact or BCG status (raises TBM prior probability)
• Prior antibiotic treatment (partially treated bacterial meningitis can mimic viral)
Governing Principles of CSF Analysis
The CSF profile of each meningitis type reflects the nature of the host immune response to the causative organism. Rather than memorising a table of numbers in isolation, understanding why each parameter takes its characteristic value in each condition lets you reason through atypical presentations — the partially treated case, the early TBM with a neutrophilic shift, the immunocompromised child with unusually low cell counts. The CSF glucose, protein, and cell-type values are not arbitrary; they are the direct biochemical readout of the pathophysiological events in the meninges. Building your understanding on this mechanistic foundation means you can derive the CSF profile from first principles even under examination pressure, and you can recognise when a result does not match the expected pattern and understand why.
Why cell type differs: The type of leucocyte recruited to the CSF is determined by the cytokine environment of the inflammatory response.
• Bacterial infection: Bacterial cell-wall components (LPS, lipoteichoic acid) trigger a rapid, massive release of IL-8 and C5a, which are potent neutrophil chemotaxins. Neutrophils dominate because bacterial killing requires the oxidative burst and proteolytic enzymes of PMNs. Result: neutrophilic (polymorphonuclear) pleocytosis.
• Viral infection: Viruses trigger a Type I interferon and IL-2/IL-4 response, recruiting lymphocytes (primarily CD8+ cytotoxic T cells and NK cells) rather than neutrophils. Viral killing is cell-mediated. Result: lymphocytic pleocytosis.
• Tuberculous infection: The Type IV hypersensitivity (delayed-type) response to mycobacterial antigens is mediated by CD4+ T cells and macrophages — both lymphocytes. Result: lymphocytic pleocytosis, indistinguishable by cell type alone from viral (hence the need for protein and glucose data).
Why glucose differs:
• In bacterial and tuberculous meningitis, the markedly elevated leucocyte count and bacteria themselves consume CSF glucose rapidly. Additionally, GLUT-1 transporter-mediated glucose transport across the inflamed BBB is impaired. Both mechanisms drive glucose very low.
• In viral meningitis, the inflammatory response is milder, leucocyte counts are lower, and the BBB disruption is minimal — CSF glucose therefore remains normal or only slightly reduced. This is the single most powerful differentiator between viral and TBM: normal CSF glucose strongly favours viral meningitis over TBM.
Why protein differs:
• CSF protein reflects BBB permeability. The more severe and necrotising the inflammation, the more protein leaks from plasma into CSF. Bacterial meningitis → moderate to marked protein elevation. TBM → the very high fibrinogen-rich exudate produces the most markedly elevated protein of any meningitis type (occasionally >500 mg/dL). Viral meningitis → mildest inflammation → mildly elevated or normal protein (50–100 mg/dL typically).
SELF-CHECK
A child with acute onset fever and meningism has CSF: WBC 2,500/mm³ (92% neutrophils), protein 185 mg/dL, glucose 24 mg/dL (serum glucose 90 mg/dL). What is the most likely diagnosis?
A. Viral meningitis
B. Tuberculous meningitis
C. Bacterial meningitis
D. Fungal meningitis
Reveal Answer
Answer: C. Bacterial meningitis
The CSF shows neutrophilic pleocytosis (92% PMNs — hallmark of bacterial meningitis), very high WBC (2,500), elevated protein (185 mg/dL), and low glucose (CSF:serum ratio = 24/90 = 0.27, well below 0.40). This is the classic bacterial meningitis CSF profile. Viral meningitis would show lymphocytic pleocytosis and normal glucose. TBM would show lymphocytic pleocytosis with very high protein and low glucose but typically <500 cells. Fungal meningitis occurs in immunocompromised hosts and is confirmed by India ink/cryptococcal antigen.
Systematic CSF Interpretation: A Step-by-Step Method
A reliable, systematic method for CSF interpretation is essential because no single parameter is pathognomonic and because the most dangerous error in meningitis — missing bacterial meningitis or TBM — is made by anchoring on one finding while ignoring another. The five-step method described below forces you to evaluate all parameters in sequence before arriving at a synthesis. It prevents both analytical errors (focusing on cell type while ignoring the glucose ratio) and interpretive anchoring (concluding viral on the basis of lymphocytes before checking whether the glucose is normal or low). Applying this method systematically in every case is a clinical habit worth building from day one of posting — the five steps take under 60 seconds once practiced and produce a documented reasoning trail that justifies the treatment decision to colleagues and supervisors. Importantly, the method integrates the clinical context at the synthesis stage: the same CSF numbers mean different things in a child with a 2-day acute illness versus a child with 3 weeks of subacute fever and a TB contact.
Step 1: Appearance
• Clear and colourless → viral or TBM (early); possibly normal
• Turbid/cloudy/frankly purulent → bacterial meningitis
• Xanthochromic (yellow) → subarachnoid haemorrhage, or very high protein (old blood or very elevated bilirubin)
• Cobweb clot on standing → strongly suggests TBM (high fibrinogen from TBM exudate)
Step 2: Cell count and differential
• WBC >1,000 with >80% neutrophils → bacterial meningitis
• WBC 100–1,000 with >80% lymphocytes → TBM or fungal
• WBC <500 with >80% lymphocytes → viral meningitis (or early TBM)
• WBC >500 with mixed neutrophils/lymphocytes → partially treated bacterial, or early shift in TBM
Step 3: Protein
• >100 mg/dL (often >200 mg/dL) → bacterial or TBM
• Very high (>500 mg/dL) → strongly suggests TBM
• Mildly elevated 50–100 mg/dL → viral
• Normal (<45 mg/dL) → normal CSF or very early viral
Step 4: Glucose ratio (CSF:serum)
Always use the ratio, not the bare CSF glucose value:
• Ratio <0.40 → bacterial or TBM (both consume glucose significantly)
• Ratio 0.40–0.60 → borderline; could be TBM or partially treated bacterial
• Ratio >0.60 → viral meningitis (glucose preserved)
Step 5: Special tests
• Gram stain + culture (bacterial) — positive in 60–80% untreated cases
• GeneXpert MTB/RIF on CSF (TBM)
• ZN stain for AFB (low sensitivity for TBM)
• India ink staining + cryptococcal antigen (fungal)
• CSF PCR for HSV, enterovirus (viral — especially in neonates or atypical cases)
Synthesis: Combine all five steps into a category, then use the clinical context (age, tempo, TB contact, immune status) to refine the probability. Treat the most dangerous diagnosis that cannot be excluded.
⚑ AI image — pending faculty review (auto-QA score 4/10; best of 3 attempts)
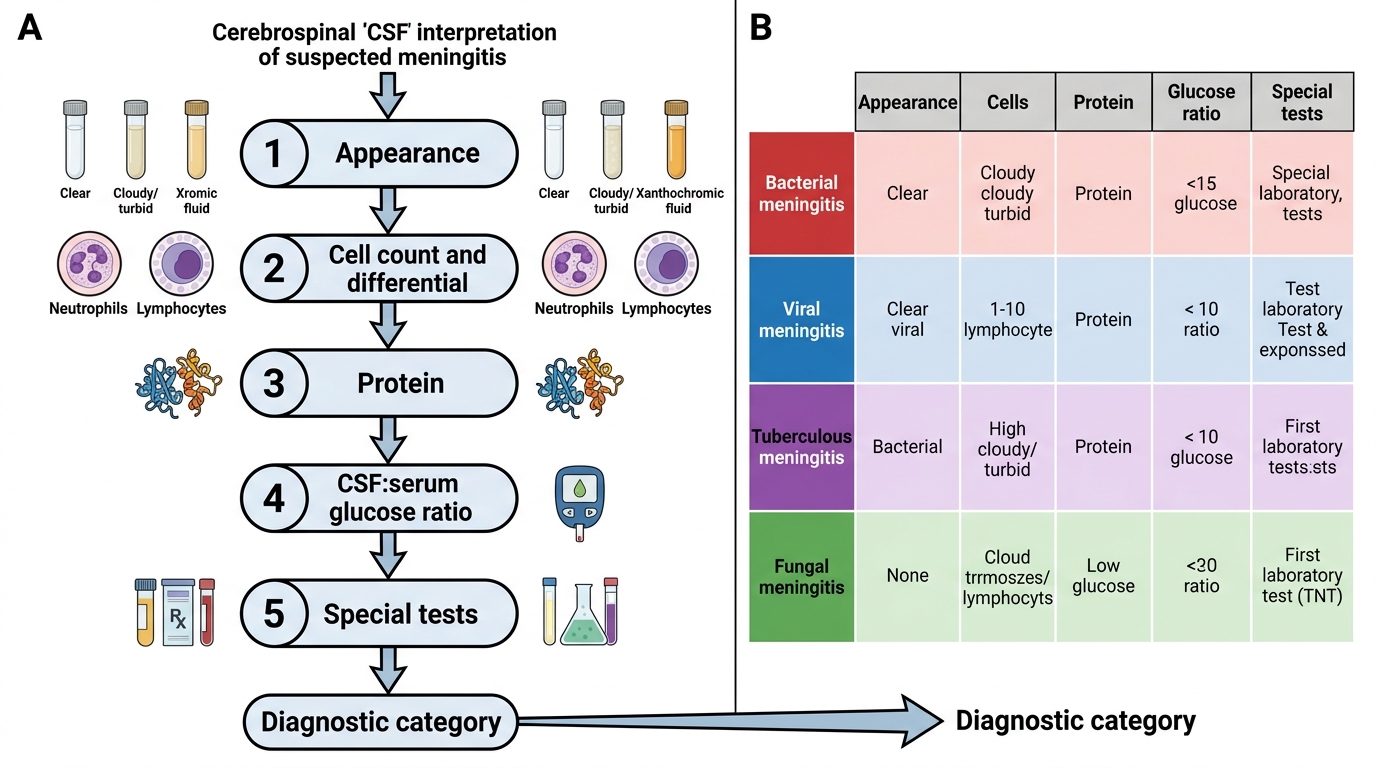
Systematic CSF Interpretation in Suspected Meningitis