Page 3 of 9
PY5.1-16 | Cardiovascular Physiology — SDL Guide (Part 3)
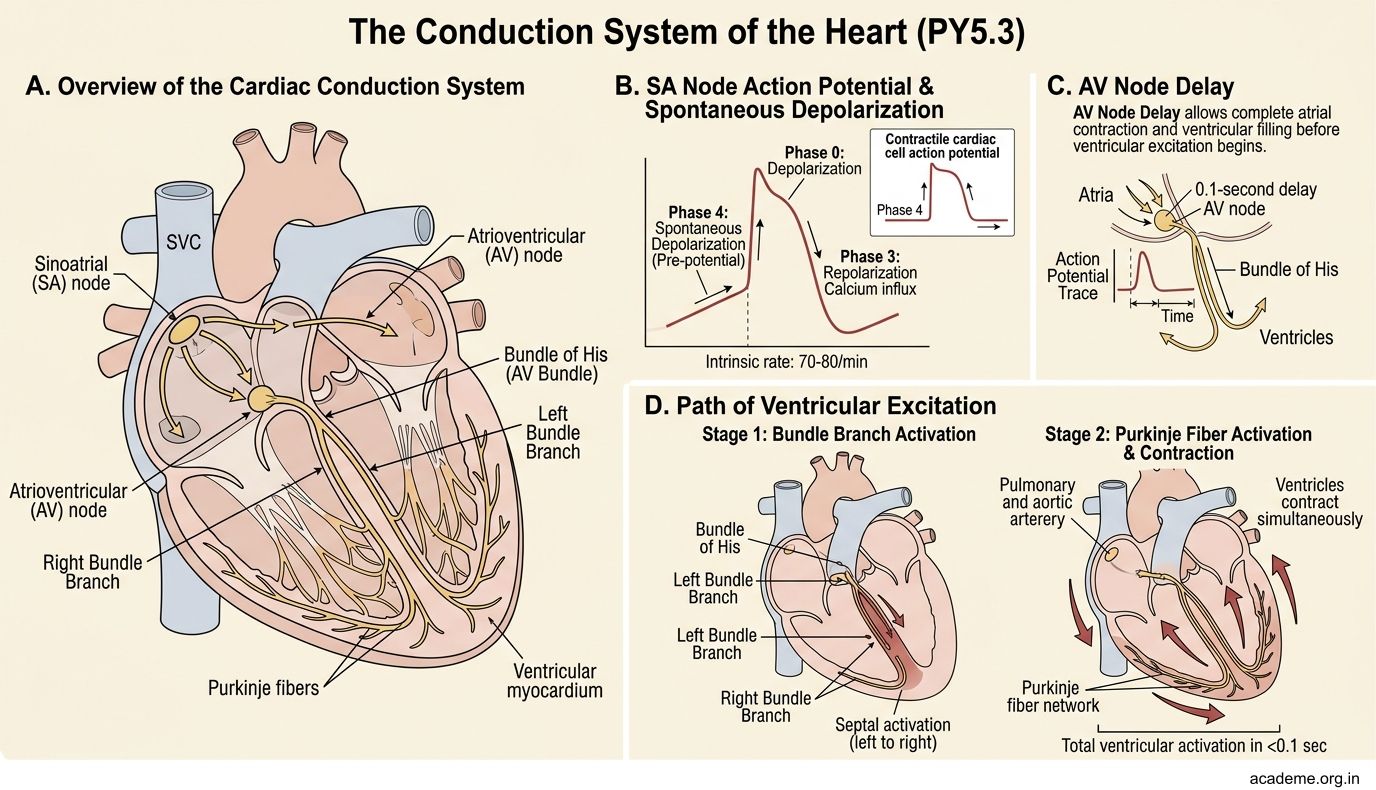
The Conduction System of the Heart (PY5.3)
The heart has its own electrical wiring — the conduction system. It ensures the atria contract before the ventricles and that both ventricles contract simultaneously for efficient pumping.

Figure: The Conduction System of the Heart (PY5.3)
The sequence of electrical activation:
- SA node (sinoatrial node) — the natural pacemaker, located in the right atrium near the SVC opening. Intrinsic rate: 70-80/min. It has Phase 4 spontaneous depolarization (pacemaker potential) due to the 'funny current' (If) — a slow inward Na+ current that gradually depolarizes the cell to threshold.
- Atrial conduction — the impulse spreads through atrial muscle (via gap junctions) and 3 internodal tracts (anterior, middle, posterior) to the AV node. Bachmann's bundle carries the impulse to the left atrium. Atrial depolarization produces the P wave on ECG.
- AV node (atrioventricular node) — located in the interatrial septum near the coronary sinus. It introduces a critical delay of 0.1 seconds (AV delay). Why? To allow the atria to finish contracting and emptying into the ventricles before ventricular contraction begins. This delay produces the PR interval (0.12-0.20 s) on ECG. The AV node is the ONLY electrical bridge between atria and ventricles.
- Bundle of His — penetrates the fibrous skeleton and divides into the right and left bundle branches in the interventricular septum. The left bundle branch further divides into anterior and posterior fascicles.
- Purkinje fibres — spread from the bundle branches to the ventricular myocardium. They conduct very rapidly (4 m/s, the fastest in the heart), ensuring both ventricles contract almost simultaneously, from apex to base. Ventricular depolarization produces the QRS complex on ECG.
Hierarchy of pacemakers: If the SA node fails, the AV node takes over at 40-60/min (junctional rhythm). If the AV node also fails, the Purkinje fibres fire at 15-40/min (idioventricular rhythm) — too slow to maintain adequate CO.
The Normal ECG — What Each Wave Means (PY5.4)
The electrocardiogram (ECG) records the electrical activity of the heart from the body surface. It does NOT record mechanical contraction — it records the spread of depolarization and repolarization.

Figure: The Normal ECG — What Each Wave Means (PY5.4)

Figure: The Normal ECG — What Each Wave Means (PY5.4)
The waves of a normal ECG:
- P wave — atrial depolarization. Small, rounded, upright in lead II. Duration < 0.12 s. Amplitude < 2.5 mm. Absence of P waves = atrial fibrillation or junctional rhythm.
- PR interval — from the start of P to the start of QRS. Represents atrial depolarization + AV delay. Normal: 0.12-0.20 s. Prolonged PR (> 0.20 s) = first-degree heart block.
- QRS complex — ventricular depolarization. The initial septal depolarization (left to right) produces the Q wave; the massive ventricular depolarization produces the R wave; the final depolarization of the basal and posterior regions produces the S wave. Duration: < 0.12 s (< 3 small squares). Wide QRS (> 0.12 s) = bundle branch block or ventricular origin of impulse.
- ST segment — the period between ventricular depolarization and repolarization. Normally isoelectric (flat). ST elevation = acute MI (current of injury). ST depression = myocardial ischaemia or digoxin effect.
- T wave — ventricular repolarization. Normally upright in leads I, II, V3-V6. Repolarization proceeds from epicardium to endocardium (opposite to depolarization), which is why the T wave is normally in the same direction as the QRS. Tall, peaked T waves = hyperkalaemia. Inverted T waves = ischaemia, LVH.
- QT interval — from start of QRS to end of T wave. Represents total ventricular electrical activity. Normal (corrected): < 0.44 s. Prolonged QT = risk of torsades de pointes (a dangerous ventricular arrhythmia).
Normal sinus rhythm criteria:
1. Regular rhythm
2. Rate 60-100 bpm
3. P wave before every QRS
4. QRS after every P wave
5. PR interval 0.12-0.20 s
6. QRS duration < 0.12 s
Heart Rate Regulation (PY5.7)
Heart rate is determined by the SA node firing rate, which is modulated by:

Figure: Heart Rate Regulation (PY5.7)

Figure: Heart Rate Regulation (PY5.7)
1. Autonomic nervous system — the primary regulators:
- Parasympathetic (vagus nerve) — releases ACh -> acts on M2 muscarinic receptors on SA node -> increases K+ permeability (IKACh) + decreases If -> slows Phase 4 depolarization -> HR decreases. The vagus is tonically active at rest — resting vagal tone keeps the HR at ~70 bpm instead of the SA node's intrinsic rate of ~100 bpm. Cutting both vagus nerves raises HR to ~100.
- Sympathetic nervous system — releases noradrenaline -> acts on beta-1 receptors -> increases If and ICa -> accelerates Phase 4 depolarization -> HR increases. Also increases conduction velocity through the AV node (decreased PR interval).
2. Hormonal factors:
• Adrenaline (circulating) — same effect as sympathetic (beta-1)
• Thyroid hormones — increase HR (hyperthyroid patients are tachycardic)
• Atrial natriuretic peptide — mildly decreases HR
3. Intrinsic factors:
• Temperature — HR increases by ~10 bpm for every 1 degree C rise in body temperature (important in fever)
• Bainbridge reflex — increased venous return stretches the right atrium -> reflex tachycardia (to pump the extra blood faster)
• Electrolytes — hyperkalaemia slows the heart; hypokalaemia can cause arrhythmias
Clinical application: Beta-blockers (propranolol, atenolol) block sympathetic beta-1 receptors -> decrease HR and contractility -> used in hypertension, angina, heart failure. Atropine blocks vagal muscarinic receptors -> increases HR -> used in bradycardia emergencies.
SELF-CHECK
A normal ECG shows a PR interval of 0.24 seconds. All other findings are normal (P before every QRS, QRS after every P, QRS < 0.12 s, rate 68 bpm). What is the likely diagnosis?
A. Normal sinus rhythm
B. First-degree AV block
C. Second-degree AV block (Mobitz type I)
D. Atrial fibrillation
Reveal Answer
Answer: B. First-degree AV block
The PR interval is prolonged (>0.20 s = >1 large square), but every P wave is followed by a QRS — this is first-degree AV block. It represents delayed conduction through the AV node. It is usually benign and doesn't need treatment. In second-degree block, some P waves would NOT be followed by QRS complexes. In atrial fibrillation, there would be no P waves at all.