Page 6 of 13
AS7.3-5 | Unconscious Patient Care, Ventilator Setup and ICU Monitoring — SDL Guide (Part 2)
Mechanical Ventilator Setup: Mode Selection and Initial Settings
Setting up a mechanical ventilator for a new patient requires a systematic approach: selecting the appropriate mode, setting the initial parameters, and configuring safety alarms. The most commonly used ventilator modes in the ICU are:
Volume-Controlled Ventilation (VCV or A/C-VC): The ventilator delivers a fixed tidal volume (VT) with each breath regardless of the pressure required. The advantage is guaranteed minute ventilation; the risk is that if lung compliance decreases (e.g. worsening ARDS, pneumothorax), airway pressure rises and can cause barotrauma. Initial settings for VCV: VT 6-8 mL/kg ideal body weight (IBW) — use IBW not actual body weight since it reflects lung size; respiratory rate (RR) 12-16 breaths/min; PEEP 5 cmH2O as a starting point (titrated upward for ARDS to maintain recruited alveoli); FiO2 1.0 initially then reduce to achieve SpO2 94-98% (target FiO2 0.40-0.60 if possible to avoid oxygen toxicity).
Pressure-Controlled Ventilation (PCV or A/C-PC): The ventilator delivers flow until a set inspiratory pressure is reached; the resulting VT depends on lung compliance and resistance. The advantage is a softer pressure waveform that is sometimes more comfortable for the patient; the risk is that VT varies with changes in compliance, so minute ventilation must be monitored closely.
Pressure Support Ventilation (PSV): A partial-support mode where the patient triggers every breath and the ventilator provides a set inspiratory pressure boost; used for weaning. Synchronised Intermittent Mandatory Ventilation (SIMV) combines mandatory machine breaths with patient-triggered spontaneous breaths; less commonly used now as PSV weaning is preferred.
Alarm configuration is safety-critical: the high-pressure alarm (set 10-15 cmH2O above expected peak pressure; activates on airway obstruction, coughing, kinking, or worsening compliance); the low-pressure alarm (set 5 cmH2O below expected; activates on ETT disconnect, cuff leak); the low SpO2 alarm (set at 90%); the apnoea alarm (backup RR triggers if patient fails to initiate a breath within a set time). Silencing alarms without investigating the cause is a recognised patient safety failure.
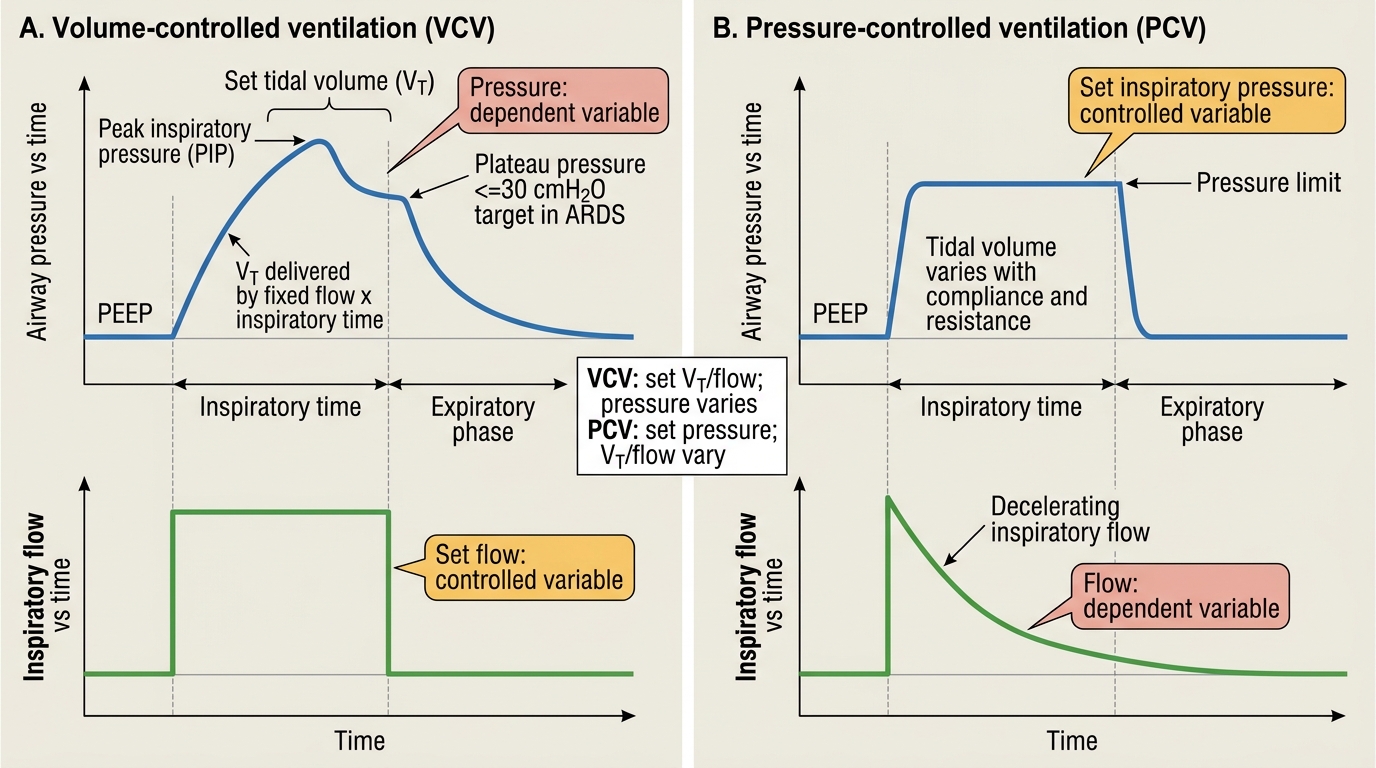
Volume-Controlled vs Pressure-Controlled Ventilation
SELF-CHECK
A 60 kg male patient (IBW 60 kg) is intubated for severe ARDS. What initial tidal volume should be set on the ventilator under a lung-protective strategy?
A. 360 mL (6 mL/kg IBW)
B. 480 mL (8 mL/kg IBW)
C. 600 mL (10 mL/kg IBW)
D. 720 mL (12 mL/kg IBW)
Reveal Answer
Answer: A. 360 mL (6 mL/kg IBW)
The lung-protective strategy for ARDS uses tidal volume of 6 mL/kg ideal body weight. For a 60 kg IBW patient: 6 x 60 = 360 mL. Using actual body weight (which may be higher in an obese patient) and higher tidal volumes (10-12 mL/kg) were the pre-ARDS-Net standard and are now contraindicated in ARDS because they cause ventilator-induced lung injury (VILI) through alveolar overdistension (volutrauma). Plateau pressure must also be checked and kept at or below 30 cmH2O.
ICU Monitoring: Assessment Framework and Principles
ICU monitoring is a continuous, integrated assessment of multiple physiological systems simultaneously. The guiding principle is that no single parameter tells the full story — a normal heart rate with a falling blood pressure and rising lactate represents a deteriorating patient; SpO2 of 98% does not rule out impending ventilatory failure if PaCO2 is 70 mmHg. Effective ICU monitoring requires knowing what each parameter measures, its limitations, and how to integrate multiple parameters into a clinical decision. The cardiovascular monitoring hierarchy in the ICU: at the minimum level, continuous ECG (rhythm and rate), non-invasive blood pressure (NIBP) at 15-minute intervals; at the intermediate level, invasive arterial blood pressure (IBP) via an arterial line providing beat-to-beat continuous waveform; at the advanced level, central venous pressure (CVP) via CVC, cardiac output monitoring (FloTrac, PiCCO), or point-of-care cardiac ultrasonography (POCUS). The respiratory monitoring hierarchy: continuous SpO2 via pulse oximetry; respiratory rate (tachypnoea is one of the earliest signs of deterioration); end-tidal CO2 (ETCO2) monitoring via capnography is mandatory for ventilated patients — sudden loss of ETCO2 waveform indicates ETT displacement or cardiac arrest; arterial blood gas (ABG) analysis every 4-8 hours in ventilated patients provides PaO2, PaCO2, pH, HCO3, base excess, and lactate. The neurological monitoring hierarchy: serial GCS assessment; pupillary reflexes (fixed dilated pupils suggest brainstem compression or herniation); continuous EEG in post-cardiac-arrest patients or those at risk of non-convulsive status epilepticus; intracranial pressure (ICP) monitoring via intraventricular or intraparenchymal probe in severe TBI (target cerebral perfusion pressure CPP = MAP minus ICP, at or above 60-70 mmHg).
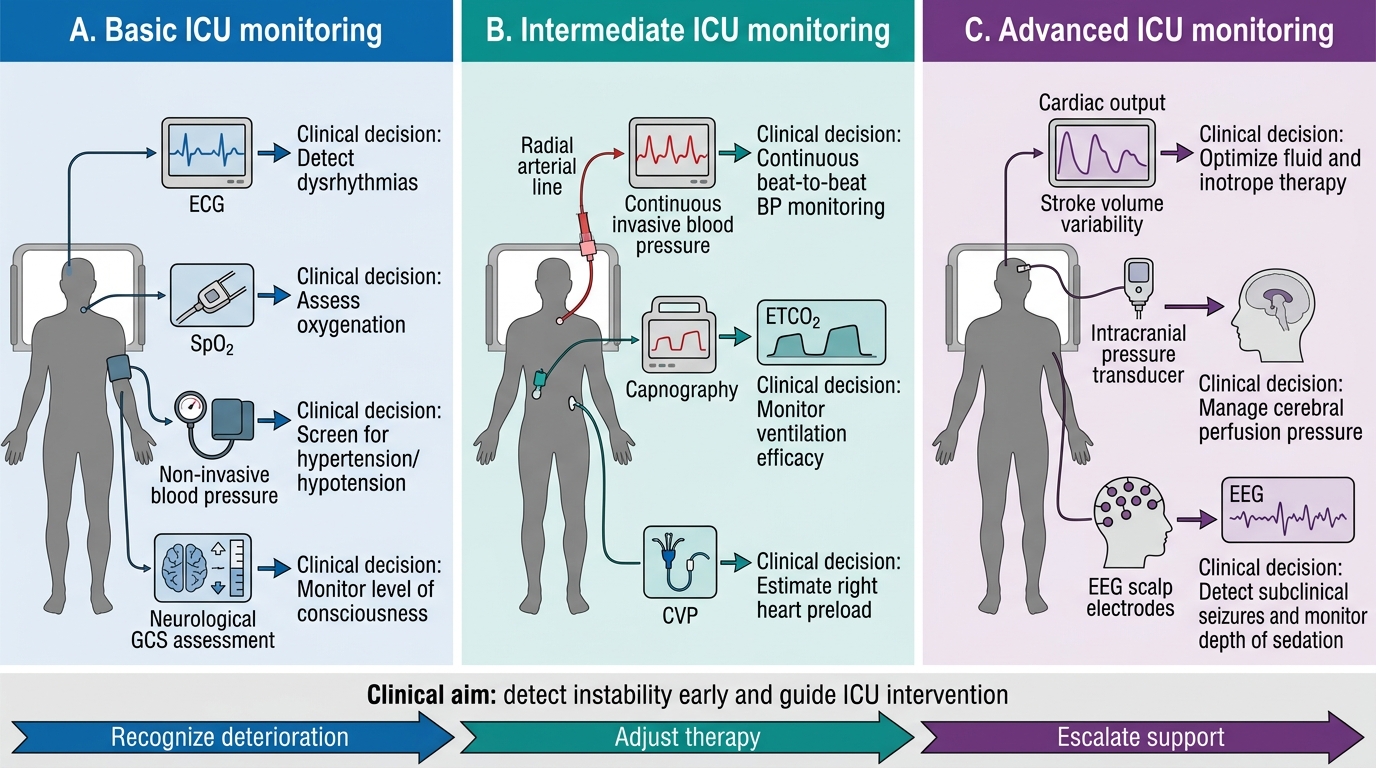
Three-Tier ICU Monitoring Overview
ICU Monitoring: Renal, Metabolic, Nutritional, and Microbiological Parameters
Beyond cardiovascular and respiratory monitoring, the ICU patient requires continuous assessment of renal function, metabolic status, nutrition, and infection. Renal monitoring centres on urine output measurement via an indwelling urinary catheter — the single most sensitive early marker of acute kidney injury (AKI) is oliguria (urine output below 0.5 mL/kg/h); daily serum creatinine and urea provide a less sensitive but quantitative measure of glomerular filtration decline; fractional excretion of sodium (FENa), urine microscopy for casts, and renal ultrasound complete the workup. Metabolic monitoring includes daily serum electrolytes (sodium, potassium, chloride, bicarbonate — critically ill patients are prone to hyponatraemia, hypokalaemia, and hypophosphataemia); blood glucose monitoring every 1-2 hours in ventilated patients (target 6-10 mmol/L in ICU; tight control to 4.5-6 mmol/L increases hypoglycaemia risk and was abandoned after the NICE-SUGAR trial showed higher mortality); daily liver function tests and coagulation profile in patients at risk of multiorgan failure. Nutritional monitoring via daily caloric intake logging (enteral feed volume received versus prescribed, gastric residual volume) and weekly albumin and pre-albumin as markers of protein synthesis. Microbiological monitoring is non-continuous but systematic: surveillance cultures (endotracheal secretions, urine, wound) every 48-72 hours in ventilated patients to detect VAP, CAUTI, or surgical site infection early; daily review of culture results and antibiogram by the ICU team and pharmacist supports targeted antibiotic de-escalation — a core antimicrobial stewardship principle.
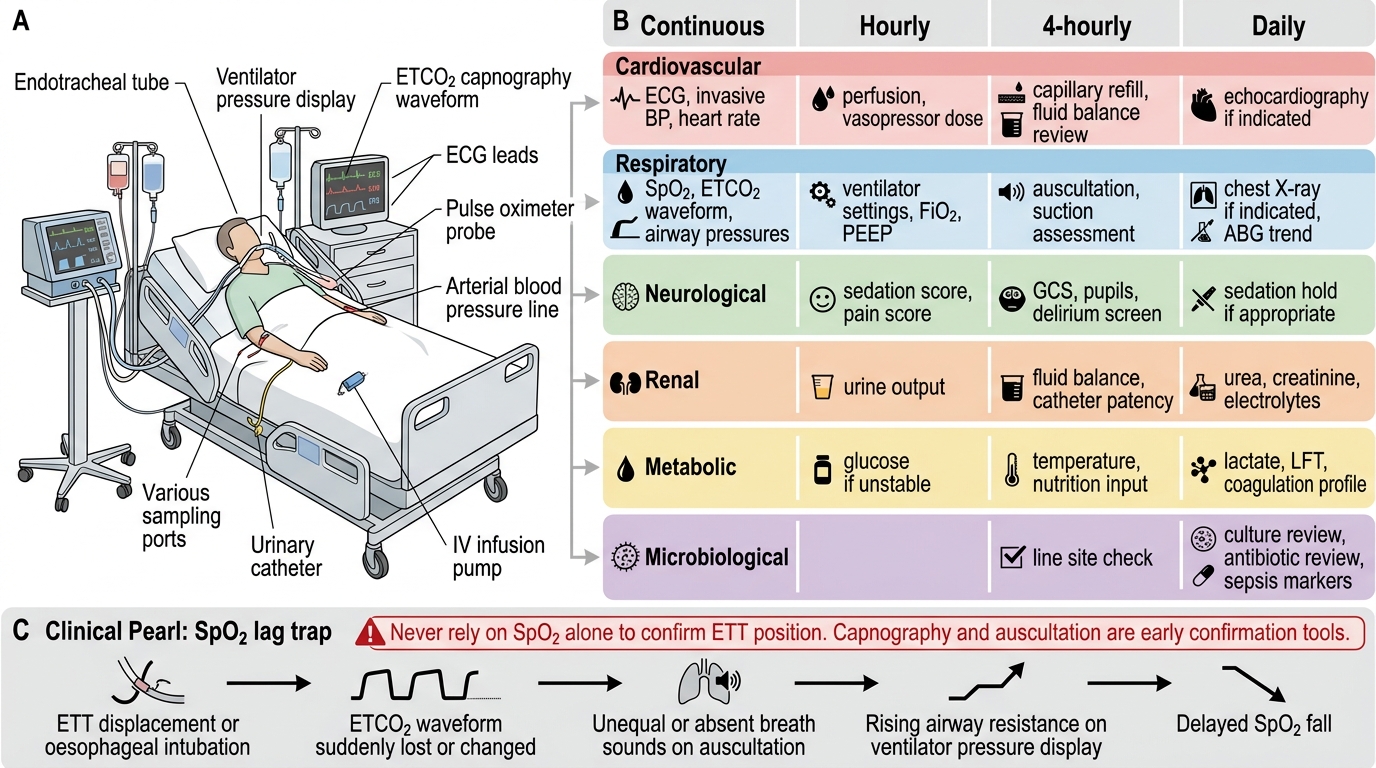
ICU Monitoring for a Ventilated Patient
CLINICAL PEARL
The SpO2 lag trap: Pulse oximetry SpO2 may remain normal (98-99%) for several minutes after a patient has been inadvertently extubated or has experienced oesophageal intubation, because the oxygen reservoir in the lungs takes time to deplete. The earliest indicators of ETT displacement are: sudden loss or change in the ETCO2 waveform on capnography, bilateral chest auscultation revealing unequal or absent breath sounds, and rising airway resistance on the ventilator pressure display. Never rely on SpO2 alone to confirm ETT position — it is a late warning. The stethoscope and capnograph confirm tube position; SpO2 only confirms oxygen content, not ventilation.