Page 1 of 13
CM6.{1-2,4} | CM6.{1-2,4} | Statistical Data Workflow — SDL Guide
Learning Objectives
- Formulate a well-structured research question using the PICO framework (CM6.1)
- Classify variables by scale of measurement and type (CM6.2, CM6.4)
- Describe and apply the five major sampling techniques with community medicine examples (CM6.4)
- Organise raw data into frequency distributions and appropriate graphical presentations (CM6.2)
- Calculate and interpret measures of central tendency (mean, median, mode) and dispersion (range, SD, SE, CV) (CM6.4)
INSTRUCTIONS
Biostatistics is not a theoretical abstraction — it is the toolkit that allows a community physician to count, compare, and conclude. Every public-health decision, from choosing a vaccination strategy to evaluating a maternal mortality programme, rests on correctly collected, classified, and summarised data. This module walks you through the full statistical data workflow: from crafting the research question that drives data collection, through the choice of sampling strategy, to the descriptive statistics that make sense of the numbers. Mastering this workflow is the foundation for the tests of significance and data analysis covered in the next module.
References
- Park K. Park's Textbook of Preventive and Social Medicine, 26th ed. Ch 2 — Epidemiology: Methods (textbook)
- Indrayan A, Malhotra RK. Medical Biostatistics, 4th ed. Chs 2–5 (textbook)
- Mahajan BK, Gupta MC. Methods in Biostatistics for Medical Students, 8th ed. Chs 1–4 (textbook)
Version 2.0 | NMC CBUC 2024
CLINICAL SCENARIO
The District Collector of a rural district receives alarming reports: neonatal mortality in three talukas has spiked this year. The Civil Surgeon must respond at tomorrow's district health committee meeting. She has two sources of data: a complete birth-death register from the Primary Health Centres, and a rapid survey her team conducted in 200 households. Before she can make any recommendation — whether to screen all deliveries at tertiary centres, train more skilled birth attendants, or request an audit of PHC drug supplies — she must know: Was the data collected correctly? Are the numbers she has comparable across talukas? Can a sample of 200 households speak for 40,000 families? And what does the average neonatal weight hide about the worst-off newborns? Every one of these questions is answered by the statistical data workflow you will master in this module.
WHY THIS MATTERS
A community physician without biostatistics is like a clinician without a stethoscope — they can observe but cannot measure, and cannot measure means cannot compare, cannot evaluate, and cannot improve. In the NMC competency framework, CM6.1–CM6.4 form the methodological backbone of community medicine: they are explicitly tested in Theory papers (short notes, MCQs on sampling methods, computations of mean/SD), and they underpin every subsequent epidemiological study design you will encounter in CM7–CM11. More immediately, MBBS internship and postgraduate entrance examinations routinely include two to four MCQs on sampling techniques and measures of dispersion. Beyond examinations, as a future Duty Medical Officer or Public Health Officer, you will routinely interpret surveillance bulletins, district health statistics, and programme evaluation reports — all built on the workflow you are learning now.
RECALL
Before proceeding, activate what you already know. From your Biology and Mathematics background: What is a variable? Can you distinguish a count (whole-number, finite) from a measurement (continuous scale)? From your Physiology Year-1 discussions: When we say 'the mean haemoglobin in Indian women is 11.5 g/dL,' what does 'mean' actually represent, and why might the median tell a different story if the distribution is skewed? And from general reasoning: If you wanted to know the prevalence of hypertension in a city of 2 million people, why might surveying every resident be impractical, and what principles should guide your selection of a smaller representative group? Carry these questions into the sections below — you will find precise answers to each.
Why Biostatistics Is the Language of Community Medicine
Community medicine operates on populations, not individuals. Whereas a clinician asks 'Is this patient anaemic?', a community physician asks 'What proportion of children under five in this district are anaemic, what factors drive anaemia in this community, and which intervention will reduce it most cost-effectively?' These questions cannot be answered by intuition or individual case reports — they require data that are systematically collected, correctly classified, rigorously summarised, and honestly interpreted. This is the domain of biostatistics: the application of statistical principles to biological and medical data.
The scale of health data in community medicine is staggering. India's National Family Health Survey (NFHS-5, 2019-21) collected data from over 636,000 households across all 28 states and 8 union territories — covering fertility, mortality, nutrition, anaemia, and health-service utilisation. The Integrated Disease Surveillance Programme (IDSP) generates weekly district-level outbreak reports from 700+ districts. The Reproductive and Child Health (RCH) portal tracks 400+ indicators in real time. Without biostatistics, this ocean of data is noise. With it, a public-health professional can extract the signal that saves lives.
Every data-driven health investigation follows a common logical sequence:
1. Formulate the research question — what exactly are you trying to find out and for whom?
2. Define and classify the variables — what types of data will you collect?
3. Choose a data collection method — census or sample? Which sampling technique?
4. Organise and present the data — frequency tables, graphs, summaries.
5. Summarise with descriptive statistics — central tendency and dispersion.
This five-step workflow is the skeleton of this module.
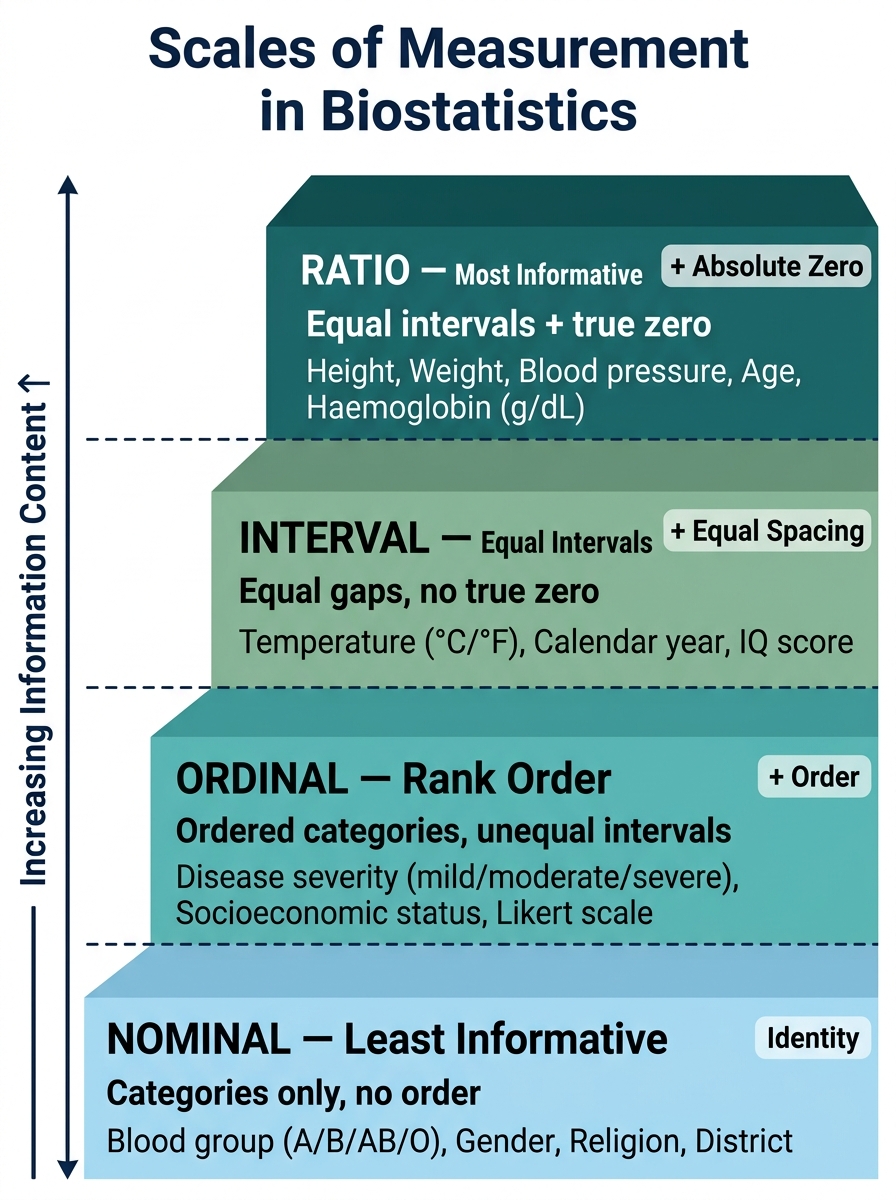
Fig. 1 — Hierarchy of Scales of Measurement (Least to Most Informative)
Formulating a Research Question: PICO and Beyond
A research question is the compass of any investigation: it determines what data you collect, from whom, by what method, and how you will analyse it. A poorly formulated question leads to irrelevant data, wasted resources, and uninterpretable results. NMC competency CM6.1 explicitly requires the ability to formulate a research question — a skill that distinguishes a scientific community physician from one who merely reports observations.
The gold standard format for quantitative research questions in community medicine is the PICO framework:
- P — Population/Problem: Who is affected? (e.g. children aged 6–59 months in Rajasthan)
- I — Intervention/Exposure: What intervention or exposure is being examined? (e.g. iron supplementation programme)
- C — Comparison: What is the alternative? (e.g. no supplementation / placebo)
- O — Outcome: What is being measured? (e.g. haemoglobin level at 3 months, prevalence of anaemia)
A PICO-structured question for our example: 'Among children aged 6–59 months in rural Rajasthan (P), does weekly iron-folic acid supplementation through Anganwadi centres (I) compared to no supplementation (C) reduce the prevalence of anaemia by ≥10 percentage points at 6 months (O)?'
Beyond PICO, a good research question must be SMART: Specific (clearly defined population and outcome), Measurable (outcome can be quantified), Achievable (feasible in available time and resources), Relevant (addresses a real public-health gap), and Time-bound (defined study period). Sources of research questions in community medicine include: national burden data (NFHS, SRS, IHME), programme evaluation gaps, local health committee observations, and unpublished field reports from health workers.
The research question directly determines the study design: a question about prevalence leads to a cross-sectional study, one about causation leads to a cohort or case-control study, one about intervention efficacy leads to a randomised controlled trial. Formulating the question clearly before designing the study — not after — is the first discipline of scientific community medicine practice.
Types of Data: Scales of Measurement
Before you can collect or analyse data, you must understand what type of data each variable represents — because the scale of measurement determines every downstream decision: which summary statistic is appropriate, which graph type is correct, and which statistical test is valid. Getting this wrong is one of the most common and consequential errors in medical research.
Variables are classified along two dimensions: scale of measurement and discreteness.
Scales of measurement (from least to most informative):
- Nominal scale — data consist of unordered, mutually exclusive categories. No mathematical relationship between categories. Examples: blood group (A/B/AB/O), sex (male/female), religion, type of disease. Statistical operations: mode, frequency, chi-square test. You cannot meaningfully say blood group B is 'greater than' blood group A.
- Ordinal scale — categories have a natural order, but the intervals between ranks are NOT necessarily equal. Examples: severity of disease (mild/moderate/severe), Likert scale responses (strongly agree to strongly disagree), cancer staging (Stage I–IV), socioeconomic status (low/middle/high). You can rank but cannot compute a meaningful mean. The difference between mild and moderate is not the same as between moderate and severe.
- Interval scale — equal intervals between values, but NO true zero point. The zero is arbitrary, not an absence of the quantity. Example: temperature in Celsius (0°C is not 'no temperature'; 40°C is not 'twice as hot' as 20°C). Ratios are meaningless. Mean and standard deviation are valid.
- Ratio scale — equal intervals AND a true zero (zero = absence of the quantity). Ratios are meaningful. Examples: weight, height, haemoglobin concentration, blood pressure, number of children, pulse rate. Nearly all continuous biological measurements are ratio-scale. Mean, SD, and geometric mean are valid.
In practice, medical data are often simplified to nominal or ordinal by applying cut-offs: haemoglobin (ratio) → anaemic/non-anaemic (nominal); BMI (ratio) → underweight/normal/overweight/obese (ordinal).
Discreteness:
- Discrete (discontinuous) variables — take only whole-number, countable values; no fractions between adjacent values. Examples: number of children, number of hospital admissions per month, parity.
- Continuous variables — can take any value on a continuum, limited only by precision of measurement. Examples: haemoglobin (g/dL), blood glucose (mmol/L), age (years), diastolic BP (mmHg).
A crucial practical point: the choice of statistical test depends on scale and distribution. Continuous ratio-scale data with approximately normal distribution → parametric tests (t-test, ANOVA). Ordinal or non-normally distributed data → non-parametric tests (Mann-Whitney, Kruskal-Wallis). Nominal data → chi-square or Fisher's exact. This linkage will be central in SDL 2.
SELF-CHECK
A researcher records disease severity as mild, moderate, or severe. What scale of measurement is this, and what is the most appropriate measure of central tendency?
A. Nominal; mode
B. Ordinal; median
C. Interval; mean
D. Ratio; mean
Reveal Answer
Answer: B. Ordinal; median
Disease severity (mild/moderate/severe) is an ordinal scale — categories have a natural order, but the intervals are not equal (the difference between mild and moderate ≠ difference between moderate and severe). For ordinal data, the median (middle rank) is the appropriate measure of central tendency; the mean is inappropriate because it implies equal intervals. The mode can also be reported but is less informative than the median for ordered categories.