Page 5 of 15
PE1.2 | Growth Assessment and Anthropometry — SDL Guide (Part 2)
Performing Anthropometric Measurements: Technique
Measurement error is the single most common cause of misclassification in growth assessment. Errors of even 0.5 kg in weight or 1 cm in length can shift a child from the MAM to SAM category or vice versa, with major consequences for management decisions. Standardised technique must therefore be rigorously applied at every measurement, not just during training. The key principle underlying all anthropometric technique is that measurements are only comparable across time and across settings if they are obtained the same way every time: same instrument type, same positioning, same measurement plane, same recorder precision. This reproducibility is what makes serial growth chart plotting meaningful. The WHO and UNICEF provide detailed standardised anthropometry protocols (the WHO STEPS manual and the Emergency Nutrition Assessment guidelines) that form the basis for the techniques described below. In daily clinical practice, a brief self-check before each measurement—zeroing the scale, confirming the child's positioning, using the correct measuring tool for the child's age—is the single most effective quality control measure available.
Measuring Recumbent Length in an Infant
Weighing technique:
- Zero the scale before each measurement (tare function).
- For infants: use a digital infant scale with a flat weighing pan. Remove all clothing and nappy/diaper. Place the infant in the centre of the pan and wait for the reading to stabilise.
- For ambulant children: use a standing scale (digital preferred). The child should wear minimal clothing (remove shoes, heavy clothing). The child stands still, weight distributed equally on both feet.
- Record weight to the nearest 0.1 kg.
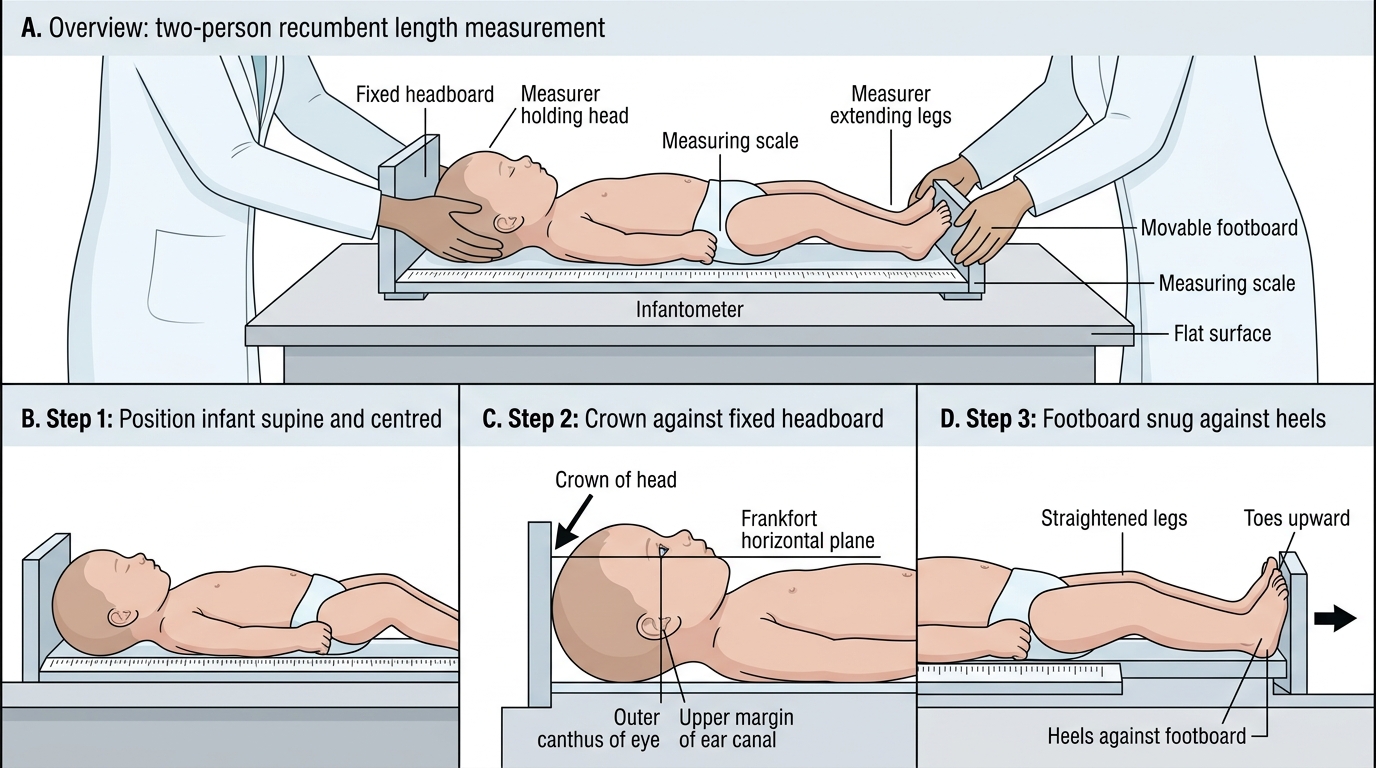
Recumbent length technique (infantometer, under 2 years):
- Requires two measurers (one to hold the head, one to extend and measure the legs).
- Place the infantometer on a flat surface. Lay the child supine with the crown touching the fixed headboard.
- The measurer at the head holds the head in the Frankfort horizontal plane (outer corner of the eye and upper margin of the ear canal on the same horizontal plane).
- The second measurer straightens both legs fully, brings the footboard snugly against the heels (toes pointing upward), and reads the measurement.
- Record to the nearest 0.1 cm.
Standing height technique (stadiometer, ≥2 years):
- The child stands barefoot, heels together, heels touching the base of the stadiometer, back straight, shoulders relaxed.
- Frankfort horizontal plane maintained (as above).
- The measurer lowers the headboard to touch the top of the head and reads the measurement.
- Record to the nearest 0.1 cm.
Head circumference technique:
- Use a non-stretchable measuring tape (metal or fibreglass, not fabric).
- Place the tape around the largest circumference of the head: just above the eyebrows anteriorly, over the most prominent part of the occiput posteriorly.
- Read to the nearest 0.1 cm.
MUAC technique:
- Identify the mid-point of the left upper arm between the tip of the acromion (shoulder) and the tip of the olecranon (elbow), with the arm hanging relaxed at the side.
- Wrap the MUAC tape around the arm at this mid-point horizontally, ensuring no gap and no compression of the tissue.
- Read to the nearest 0.1 cm (or use the colour code on the MUAC tape directly: red <11.5 cm, yellow 11.5–12.5 cm, green >12.5 cm).
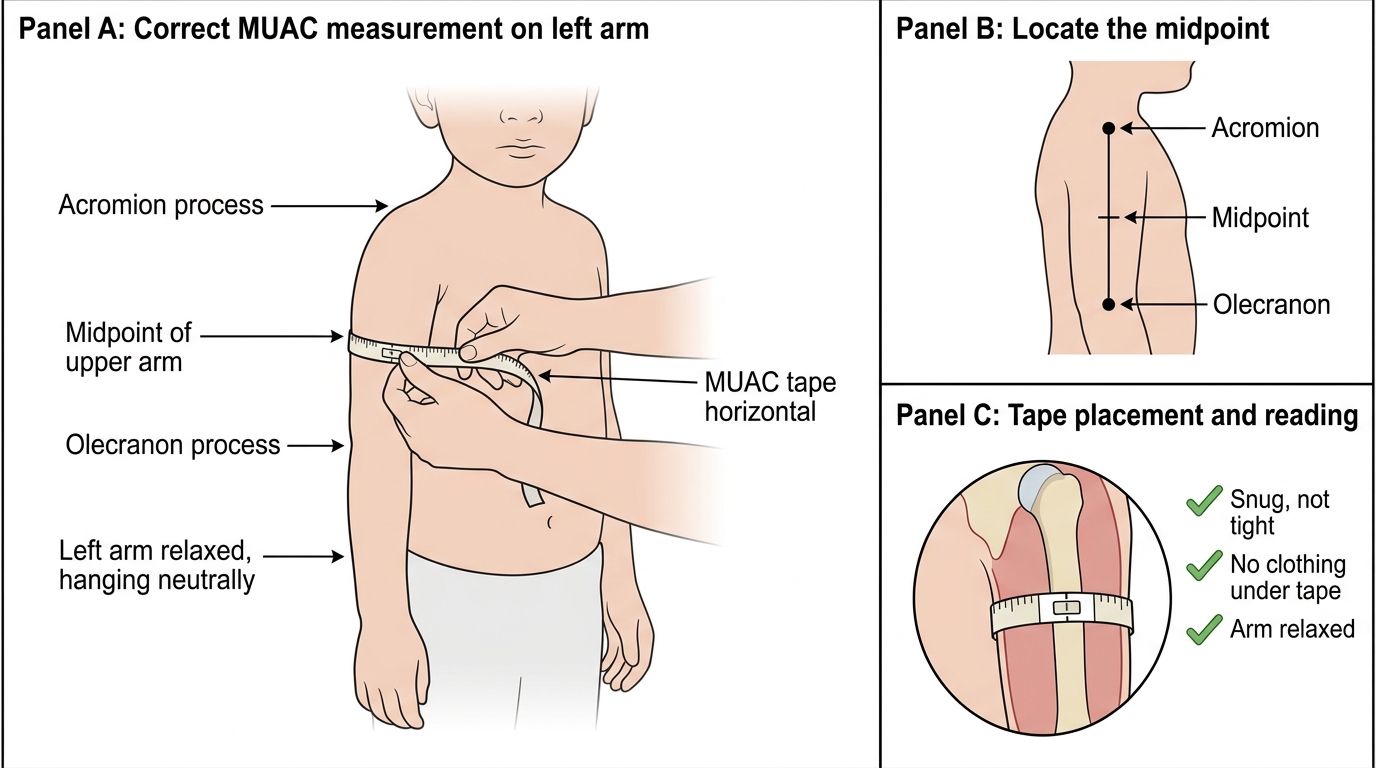
Correct MUAC Measurement Technique
Documenting Measurements on Growth Charts
A measurement that is not plotted on a growth chart is of limited clinical value—it gives attained size but no context. Plotting on a chart transforms a raw number into a percentile or SD-score position relative to the reference population, and a series of plotted points reveals the trajectory over time, which is the clinically meaningful signal. The growth chart is therefore not merely a record-keeping tool; it is an active clinical decision aid. When a child's plotted weight crosses two major percentile lines downward between two visits, that crossing is as much a clinical finding as a positive blood test—it mandates an explanation and a management plan. Conversely, a child whose measurements consistently track along the same percentile curve, even if that curve is low (e.g. the 5th percentile), is demonstrating normal velocity for that child. The ability to distinguish these two patterns—tracking vs crossing—is the core interpretive skill that growth chart documentation enables. Choosing the right chart type for the right clinical question is the prerequisite to correct interpretation, and is therefore the first plotting decision.
Steps for plotting:
1. Identify the correct chart: weight-for-age (birth–5 yr, or 0–18 yr), length-for-age or height-for-age, weight-for-length/height, BMI-for-age. Choose based on the child's age and the clinical question (acute vs chronic malnutrition).
2. Find the child's age on the horizontal axis. Use exact age (in months for under-2; in years and months for older children).
3. Find the measurement value on the vertical axis.
4. Mark the intersection of the age and value with a dot. If serial measurements are available, connect dots with a line to show the trajectory.
5. Compare the child's position to the reference lines (percentile curves or SD lines). On WHO charts, the key reference lines are +2, +1, 0 (median), −1, −2, and −3 SD.
Which chart for which clinical question:
- Weight-for-age: simple first screen; detects underweight (below −2 SD) but cannot distinguish wasting (acute) from stunting (chronic).
- Height/length-for-age: detects stunting (chronic cumulative growth failure, height-for-age <−2 SD).
- Weight-for-height/length: detects wasting (acute malnutrition; weight-for-height <−2 SD). This is the index used for SAM/MAM classification.
- BMI-for-age: used from 2 years for overweight (+1 to +2 SD on IAP 2015) and obesity (>+2 SD).
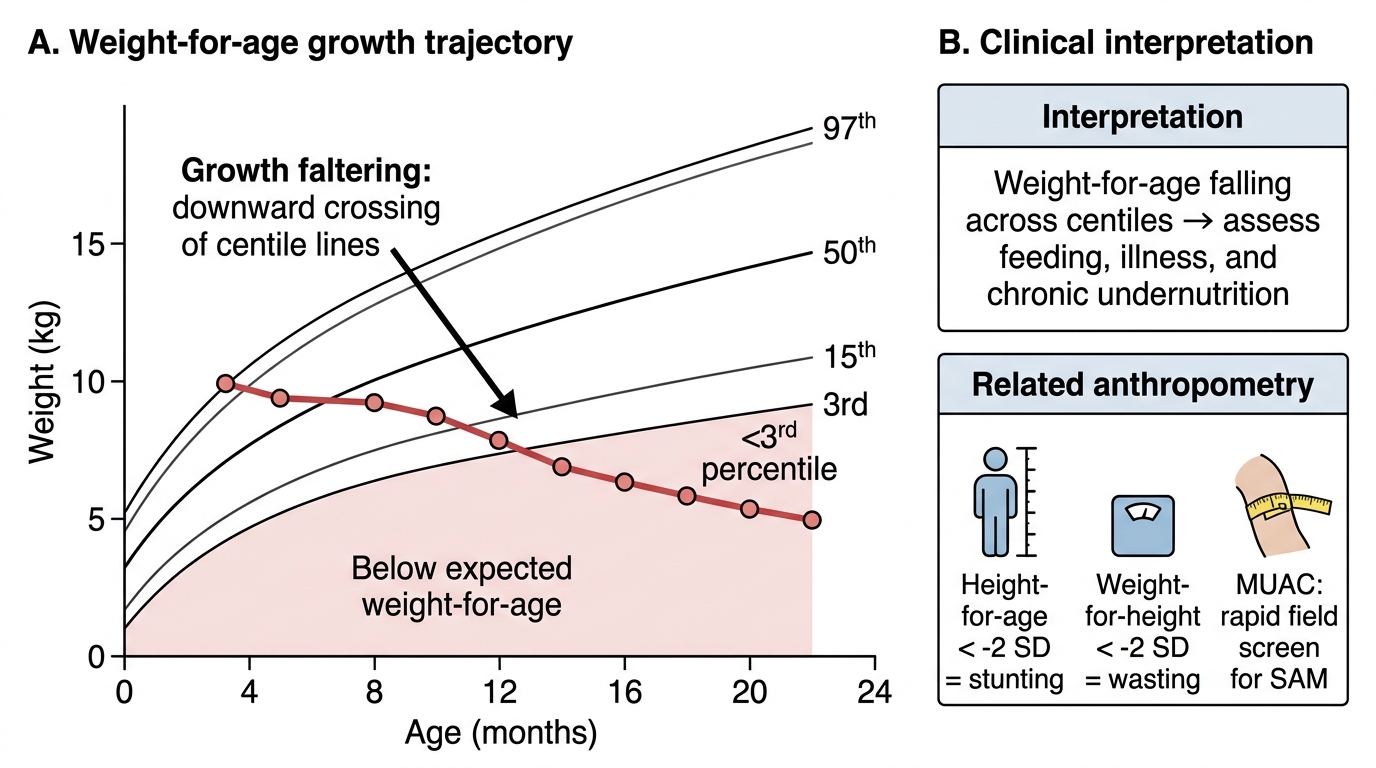
Growth Faltering on Weight-for-Age Chart
SELF-CHECK
A 30-month-old child's height is plotted at −2.5 SD on the WHO height-for-age chart. Weight-for-height is −1.5 SD. This pattern is most consistent with:
A. Acute malnutrition (wasting) with normal linear growth
B. Chronic malnutrition (stunting) with adequate current nutritional status
C. Severe acute malnutrition (SAM)
D. Normal growth within reference range
Reveal Answer
Answer: B. Chronic malnutrition (stunting) with adequate current nutritional status
Height-for-age at −2.5 SD indicates stunting (height-for-age <−2 SD), reflecting chronic cumulative growth failure. Weight-for-height at −1.5 SD is within the normal range (above −2 SD), indicating the child's weight is appropriate for their (stunted) height—meaning current acute nutritional status is adequate. This is chronic malnutrition without concurrent acute wasting. SAM requires weight-for-height <−3 SD or MUAC <11.5 cm.
CLINICAL PEARL
MUAC is the faster and often more reliable field tool than weight-for-height for detecting SAM in community settings. Weight-for-height requires an accurate weight, an accurate height, access to a reference table or chart, and freedom from oedema (oedema falsely elevates weight, making wasting look less severe). MUAC requires only a colour-coded tape and the ability to find the arm mid-point. Studies from humanitarian emergency settings show that MUAC alone, using the <11.5 cm cut-off, identifies children at highest risk of mortality with comparable sensitivity to weight-for-height. However, bilateral pedal oedema must always be checked independently—a child with kwashiorkor (nutritional oedema) may have a MUAC above the SAM cut-off due to tissue oedema, yet is severely malnourished and at high mortality risk. MUAC + oedema check together = complete SAM screening.
Interpreting Growth Chart Findings
Interpretation of growth chart data requires not just reading the SD position at one time point, but understanding what the index, the cut-off, and the trajectory together mean for the individual child. Misinterpretation—either over-diagnosing malnutrition in a constitutionally small child or under-diagnosing it in a child whose measurements are trending downward—carries real clinical consequences. The key conceptual framework is that different indices answer different clinical questions: weight-for-height (or weight-for-length) answers 'is this child acutely malnourished right now?'; height-for-age answers 'has this child experienced sustained growth failure over the past months to years?'; and weight-for-age is a composite that cannot distinguish the two. This distinction is practically important because a stunted child who is weight-appropriate for their stunted height may appear to have low weight-for-age but is not acutely malnourished and does not need emergency therapeutic feeding—a misclassification with potential harm. The trajectory of measurements over time provides the temporal dimension that a single measurement cannot: a child crossing from the 50th to the 10th percentile on weight-for-height over three months is showing acute deterioration that demands immediate evaluation, even though the absolute value at the second measurement may still be above the −2 SD cut-off.
Provided image
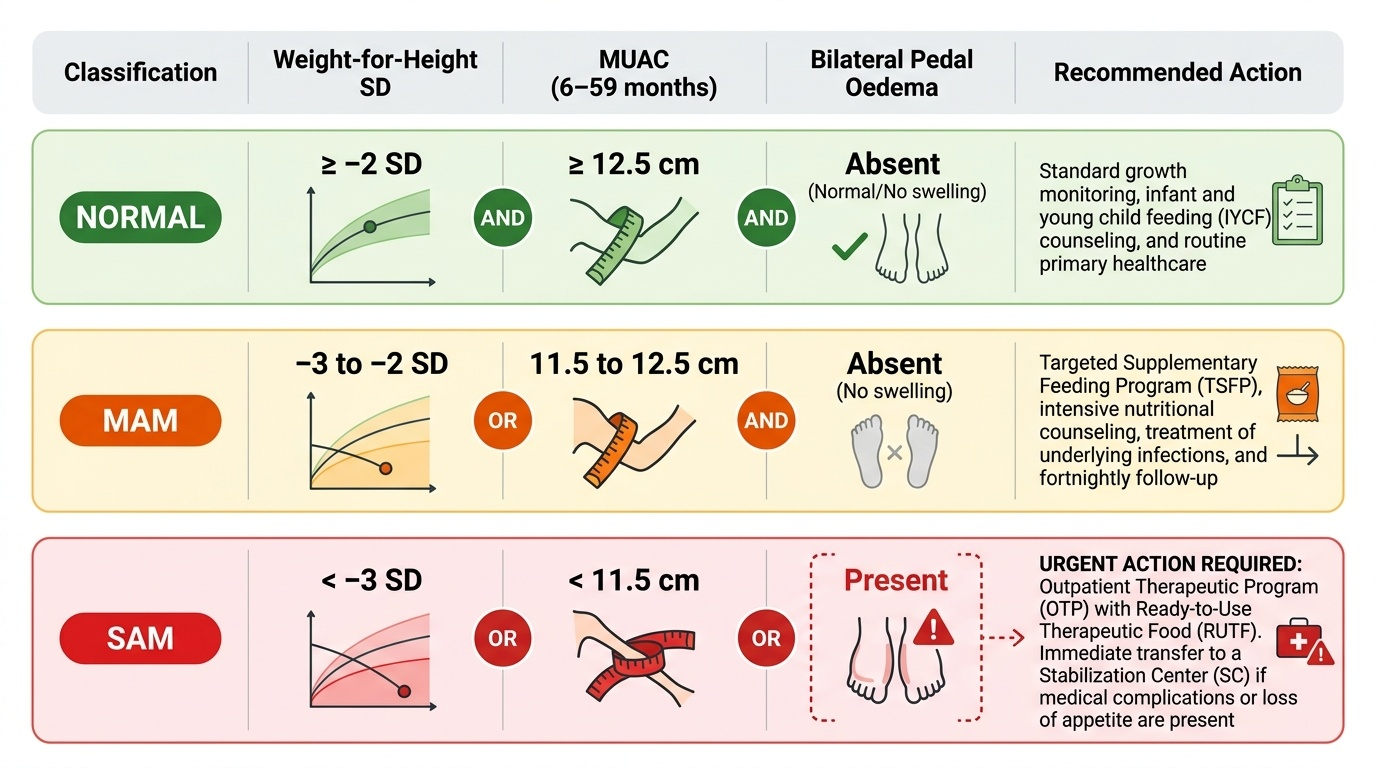
Nutritional status classification (WHO/IMNCI, weight-for-height and MUAC):
- Normal: weight-for-height ≥−2 SD AND MUAC ≥12.5 cm AND no bilateral pedal oedema.
- Moderate acute malnutrition (MAM): weight-for-height −3 to −2 SD OR MUAC 11.5–12.5 cm (in the absence of oedema).
- Severe acute malnutrition (SAM): weight-for-height <−3 SD OR MUAC <11.5 cm (6–59 months) OR bilateral pedal oedema (regardless of other measurements).
The presence of bilateral pedal oedema alone (kwashiorkor) classifies a child as SAM even if weight-for-height and MUAC are in the normal range, because oedema masks the true tissue deficit.
Stunting and underweight:
- Stunting: height-for-age <−2 SD; reflects chronic cumulative growth failure over months to years. It signals a sustained deficit in nutrition, recurrent illness, or both. Stunting is largely irreversible after 2 years of age.
- Underweight: weight-for-age <−2 SD; a composite index that can reflect both stunting and wasting together. It is less specific than weight-for-height for identifying current acute malnutrition.
Overweight and obesity:
- Under 5: weight-for-height >+2 SD = overweight; >+3 SD = obese (WHO 2006).
- 5–18 years: BMI-for-age >+1 SD = overweight; >+2 SD = obese (IAP 2015).
Trajectory interpretation: A child whose weight-for-age is consistently at the 3rd percentile but tracking parallel to the reference curves is small but growing normally—this is likely constitutional or reflects chronic mild stunting. A child whose weight has crossed from the 50th to the 15th percentile over 3 months is showing acute growth faltering that requires active investigation, even if the absolute measurement is still above −2 SD.
SELF-CHECK
A 2-year-old child has weight-for-height of −2.5 SD, MUAC of 11.8 cm, and bilateral pitting oedema of both feet. The correct nutritional classification is:
A. Moderate acute malnutrition (MAM)
B. Severe acute malnutrition (SAM)
C. Stunting without acute malnutrition
D. Normal nutritional status
Reveal Answer
Answer: B. Severe acute malnutrition (SAM)
Bilateral pedal oedema alone is sufficient to classify a child as SAM (kwashiorkor pattern), regardless of weight-for-height or MUAC values. Here weight-for-height is −2.5 SD (MAM range) and MUAC is 11.8 cm (MAM range), but the presence of bilateral oedema overrides both and mandates SAM classification. Children with oedematous malnutrition require the same urgent inpatient management as SAM without oedema.