Page 9 of 24
PA2.{3,6-7} | Cellular Adaptations, Accumulations & Aging — SDL Guide
Learning Objectives
- Describe the five cellular adaptations — atrophy, hypertrophy, hyperplasia, metaplasia, and dysplasia — including their causes, mechanisms, and reversibility.
- Distinguish metaplasia from dysplasia and explain the adaptation-to-neoplasia continuum.
- Identify the morphological changes seen in intracellular accumulations of lipids, proteins, glycogen, and pigments.
- Explain the principal mechanisms of cellular aging, including telomere shortening, DNA damage accumulation, defective protein homeostasis, and reduced replicative capacity.
INSTRUCTIONS
Cells under persistent stress do not simply die — they adapt. Understanding how cells reshape themselves in response to altered demand is the foundation of recognising early disease, interpreting biopsies, and predicting when a 'reversible' change tips into irreversible injury. This module builds directly on the cell injury concepts from SDL 1 and SDL 2 and introduces the spectrum from adaptation to neoplasia.
References
- Robbins & Cotran Pathologic Basis of Disease, 10th ed., Ch. 2 (textbook)
- Harsh Mohan Textbook of Pathology, 8th ed., Ch. 2 (textbook)
Version 2.0 | NMC CBUC 2024
CLINICAL SCENARIO
A 45-year-old bodybuilder's heart weighs 520 g at autopsy (normal ~350 g). A 60-year-old smoker's bronchial epithelium has been replaced by squamous cells. A chronic alcoholic's liver is pale, greasy, and swollen. These are not diseases of cell death — these cells are alive, but profoundly altered. What drove these changes, and when do they become dangerous?
WHY THIS MATTERS
Cellular adaptations underlie a wide range of clinical findings you will encounter across all systems — cardiac hypertrophy on ECG, Barrett's oesophagus on endoscopy, cervical dysplasia on Pap smear, hepatic steatosis on ultrasound. Recognising these patterns early allows intervention before irreversible neoplastic transformation occurs. PA2.6, PA2.3, and PA2.7 are assessed in clinical reasoning OSCEs and in long-case pathology spotters.
RECALL
Before proceeding, recall from SDL 1 (Cell Injury):
• The distinction between reversible and irreversible cell injury.
• The role of the mitochondria and calcium in the 'point of no return'.
• The concept that the same stimulus at different intensities produces adaptation, injury, or death.
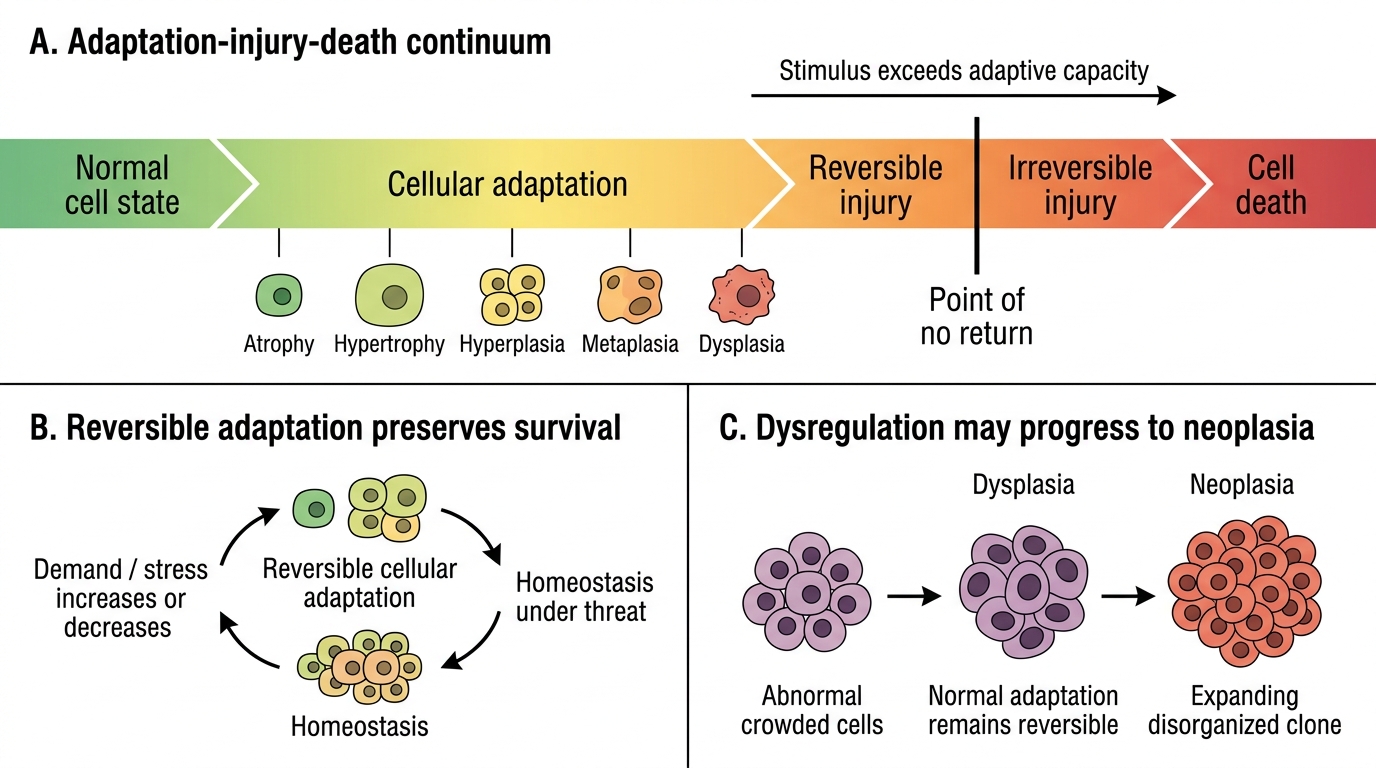
Adaptations represent the cell's attempt to reach a new steady state under sublethal stress. If the stress exceeds the cell's adaptive capacity, injury and death follow.
Overview: The Adaptation–Injury–Death Continuum
Cells can respond to increased or decreased demand, or to persistent sublethal stress, by altering their size, number, type, or metabolic activity. These cellular adaptations are reversible responses that allow survival; they are not disease per se, but they signal that homeostasis is under threat.
The spectrum runs:
Normal → Adaptation (atrophy / hypertrophy / hyperplasia / metaplasia / dysplasia) → Reversible injury → Irreversible injury (necrosis/apoptosis)
Key principle: adaptations lie within the normal regulatory mechanisms of the cell. When stimuli exceed adaptive capacity, or when adaptations themselves become dysregulated (as in dysplasia), the transition to neoplasia can occur.
Adaptation-Injury-Death Continuum
Atrophy
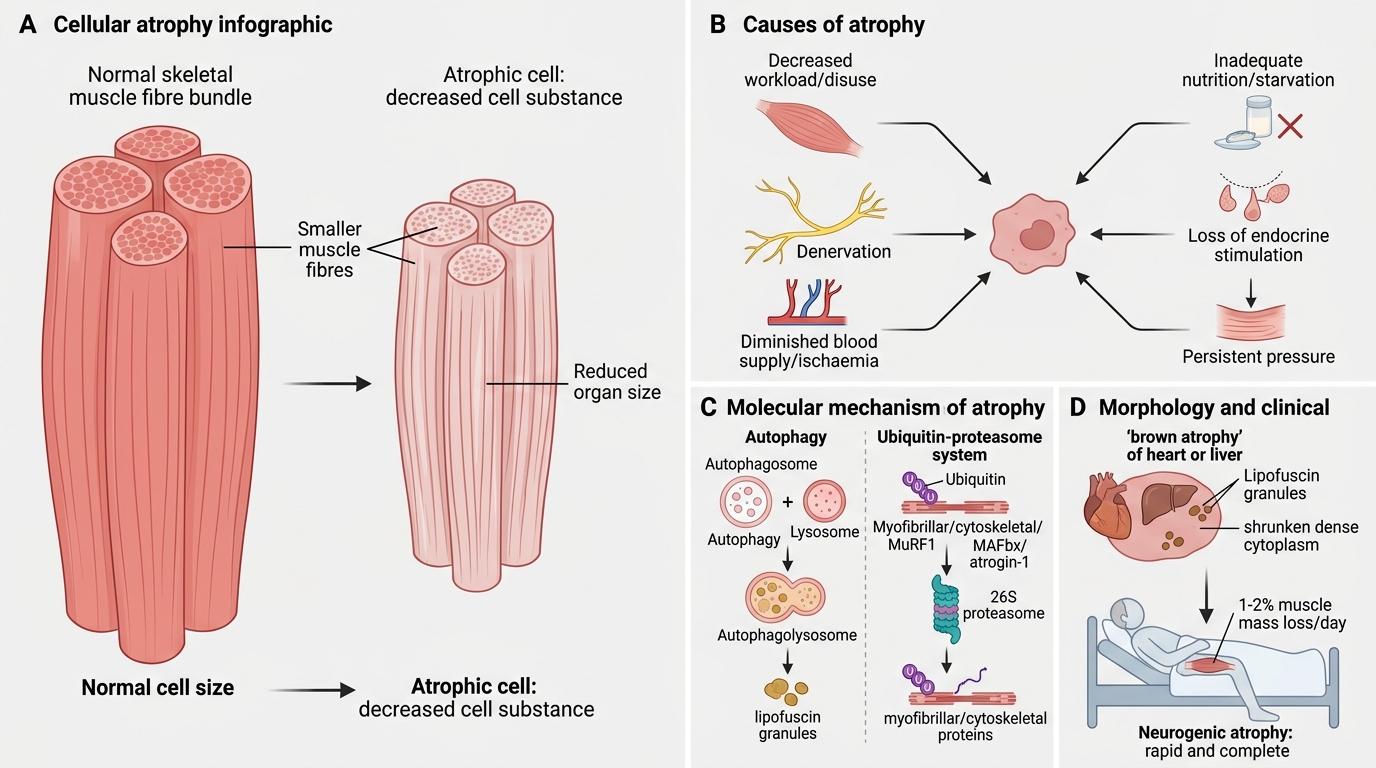
Atrophy: Causes, Mechanisms and Morphology
Atrophy is a decrease in cell size (and thus organ size) due to loss of cell substance, often with a reduction in cell number as well.
Causes:
• Decreased workload (disuse atrophy — immobilised limb)
• Loss of innervation (denervation atrophy)
• Diminished blood supply (ischaemic atrophy)
• Inadequate nutrition (starvation)
• Loss of endocrine stimulation (post-menopausal endometrial atrophy)
• Persistent pressure (pressure atrophy of brain in hydrocephalus)
Mechanisms — two interlocking pathways:
1. Autophagy — the cell digests its own organelles via autophagolysosomes to generate energy; produces lipofuscin granules as a residue.
2. Ubiquitin–proteasome pathway — degradation tags (ubiquitin) attach to cytoskeletal proteins; the 26S proteasome destroys them. Upregulation of ubiquitin-ligases (MuRF1, MAFbx/atrogin-1) is central to muscle atrophy.
Morphology: Shrunken cells with dense cytoplasm; increased lipofuscin granules ('brown atrophy' of heart/liver).
Clinical: Bed-bound patients lose ~1–2% muscle mass per day. Neurogenic atrophy (LMN lesion) is more rapid and complete than disuse atrophy.
SELF-CHECK
A 70-year-old man is bedridden for 6 weeks after a hip fracture. Which molecular pathway is primarily responsible for the loss of muscle bulk in his right thigh?
A. Mitochondrial permeability transition pore opening
B. Upregulation of ubiquitin-ligases targeting myofibrillar proteins
C. Activation of the NLRP3 inflammasome
D. Fas-FasL apoptotic signalling
Reveal Answer
Answer: B. Upregulation of ubiquitin-ligases targeting myofibrillar proteins
Disuse (and denervation) atrophy is driven primarily by the ubiquitin–proteasome pathway: muscle-specific E3 ligases (MuRF1, atrogin-1) tag myofibrillar proteins for 26S proteasome degradation. Autophagy also contributes, but ubiquitin-ligase upregulation is the dominant and most studied mechanism.
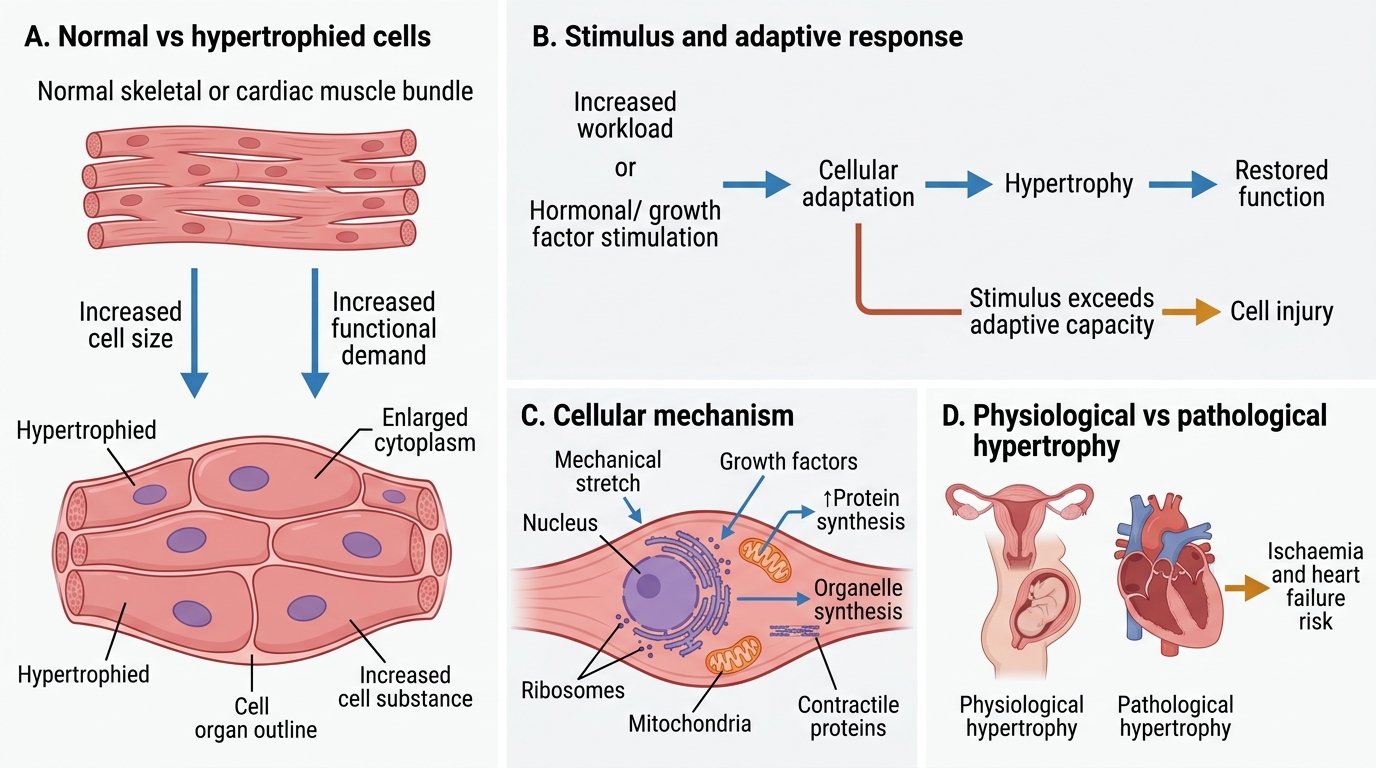
Hypertrophy
Hypertrophy is an increase in cell size (and hence organ size) without an increase in cell number. It occurs in cells that have limited capacity to divide (muscle cells, cardiac myocytes).
Physiologic hypertrophy:
• Skeletal muscle hypertrophy with exercise
• Uterine hypertrophy in pregnancy (smooth muscle cells enlarge ~10-fold)
Pathologic hypertrophy:
• Cardiac hypertrophy due to pressure overload (systemic hypertension, aortic stenosis → concentric left ventricular hypertrophy) or volume overload (mitral regurgitation → eccentric hypertrophy)
Mechanism (cardiac): Mechanical stretch + neurohormonal signals (angiotensin II, catecholamines, IGF-1) activate PI3K/Akt and calcineurin-NFAT pathways → increased synthesis of sarcomeric proteins (actin, myosin) → larger myocytes with more contractile elements.
Foetal gene re-expression: Hypertrophied myocardium re-expresses foetal isoforms (β-myosin heavy chain, atrial natriuretic peptide), reducing efficiency. This is why longstanding hypertrophy can progress to dilated cardiomyopathy and heart failure.
Morphology: Myocytes 2–3× normal diameter; enlarged, 'boxcar' nuclei.
Hypertrophy: Adaptive Increase in Cell Size