Page 3 of 24
PA1.1-3,PA2.1-2 | Introduction to Pathology & Mechanisms of Cell Injury — SDL Guide (Part 3)
Reversible Cell Injury — Morphology and Function
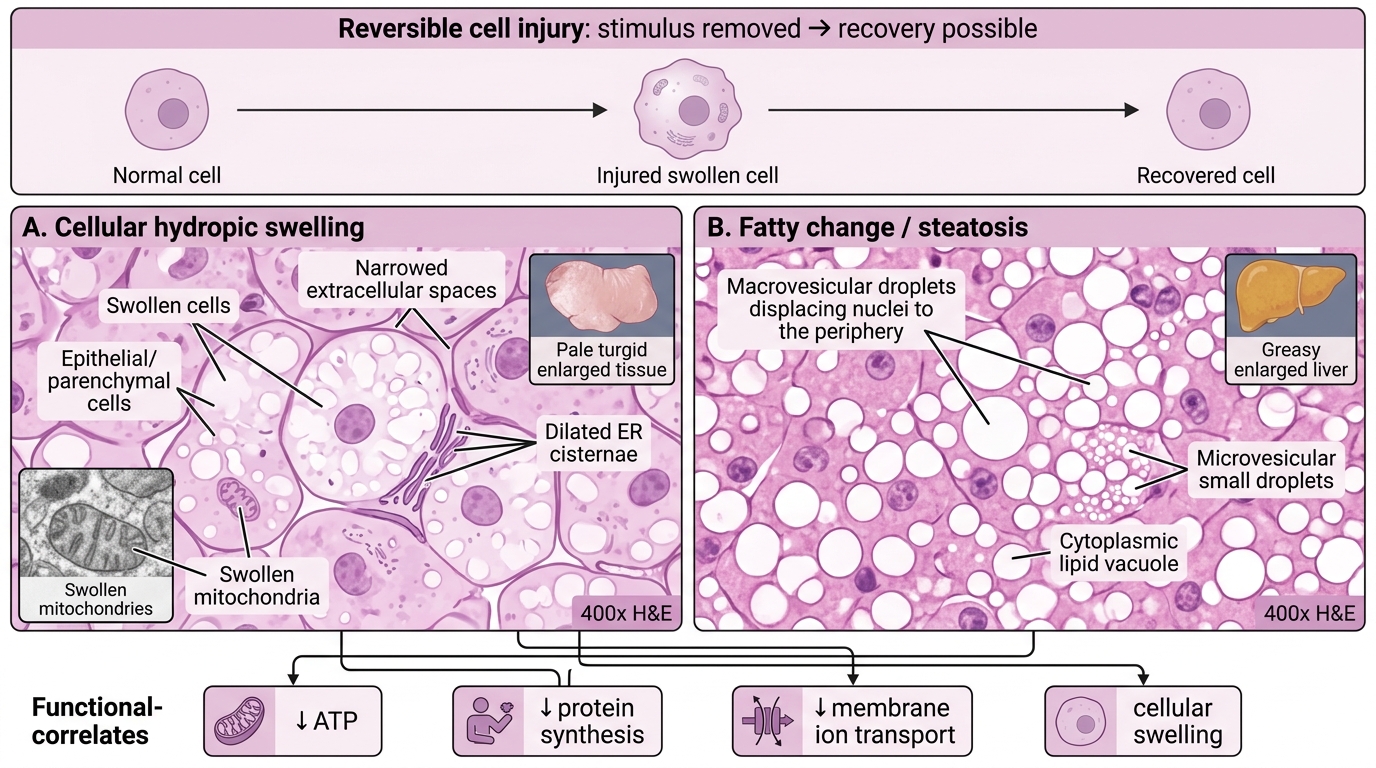
Reversible Cell Injury: Hydropic Swelling and Fatty Change
Reversible cell injury is injury in which the cell can return to normal if the stimulus is removed. The key morphological hallmarks are:
1. Cellular (hydropic) swelling
- The most common and earliest change.
- Gross: organ appears pale, turgid, increased weight.
- Microscopy: cells enlarged, cytoplasm pale and vacuolated; organelle changes visible on EM — ER cisternae dilated, mitochondria swollen with small amorphous densities.
- Reversible if the injurious stimulus is removed promptly.
2. Fatty change (steatosis)
- Occurs predominantly in cells with active lipid metabolism: hepatocytes, cardiac myocytes, renal tubular cells.
- Mechanism: impaired lipoprotein export (↓apolipoprotein synthesis), increased fatty-acid mobilisation from adipose, impaired β-oxidation.
- Gross: liver appears yellow, greasy, enlarged (fatty liver).
- Microscopy: clear cytoplasmic vacuoles (lipid dissolved out during processing); large droplets displace the nucleus to periphery (macrovesicular) or small droplets (microvesicular).
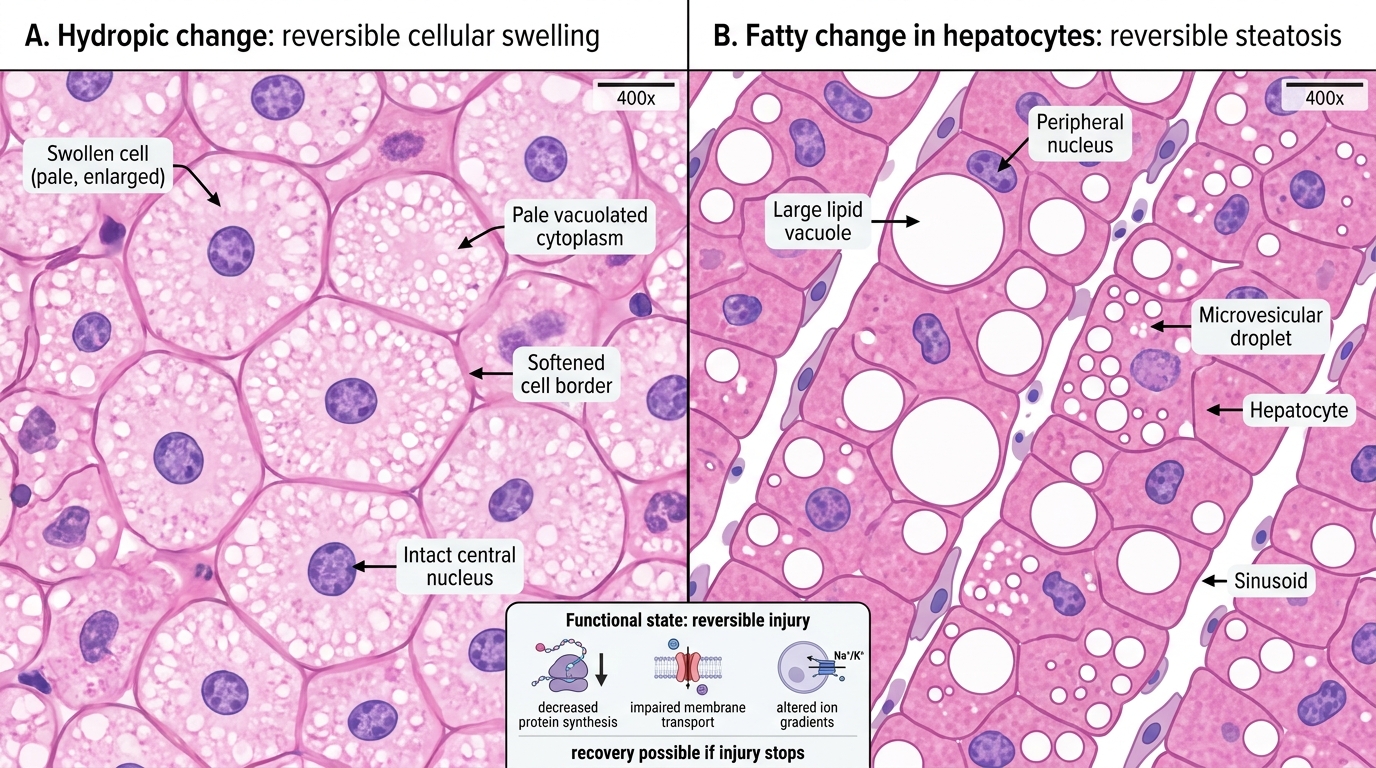
Reversible Cell Injury on H&E: Hydropic Change vs Fatty Change
Functional correlates: during reversible injury, cells show ↓protein synthesis, ↓membrane transport, altered ion gradients — but these recover. The cell has not yet activated irreversible death pathways.
Irreversible Cell Injury — The Point of No Return
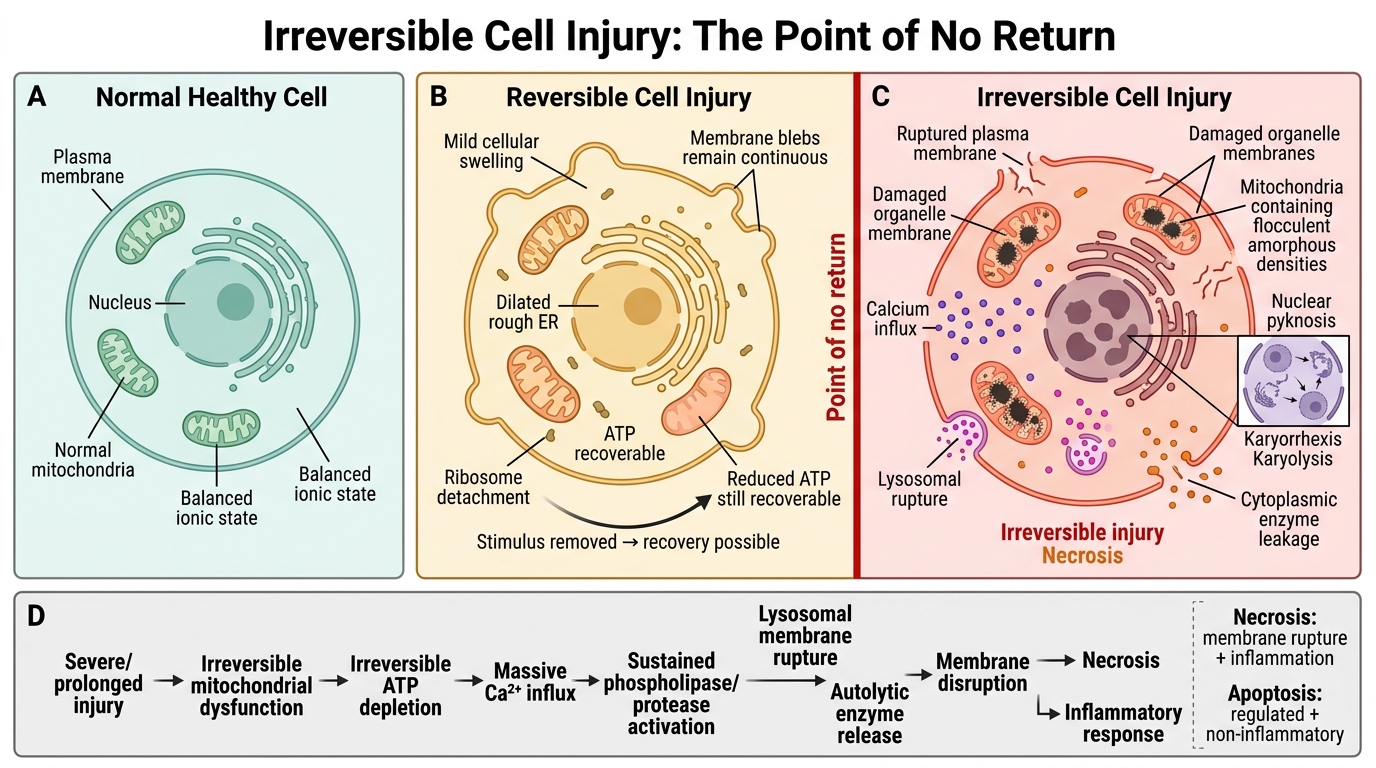
Irreversible Cell Injury: Point of No Return
Irreversible cell injury occurs when damage is severe or prolonged enough that the cell cannot recover even if the injurious stimulus is removed. Distinguishing features from reversible injury:
Morphological hallmarks of irreversibility:
- Severe membrane damage — large discontinuities in plasma and organelle membranes.
- Mitochondrial permeability transition (MPT) with large, flocculent (amorphous) densities in the mitochondrial matrix — the most reliable early EM marker of irreversibility.
- Nuclear changes: pyknosis (condensation), karyorrhexis (fragmentation), karyolysis (dissolution).
Biochemical triggers of the point of no return:
1. Inability to reverse mitochondrial dysfunction → irreversible ↓ATP.
2. Massive Ca²⁺ influx → sustained phospholipase/protease activation.
3. Lysosomal membrane rupture → autolytic enzyme release.
The end result is necrosis — a pathological cell death characterised by enzymatic digestion of cellular contents, membrane disruption, and inflammatory response (contrast with apoptosis, which is regulated and non-inflammatory).
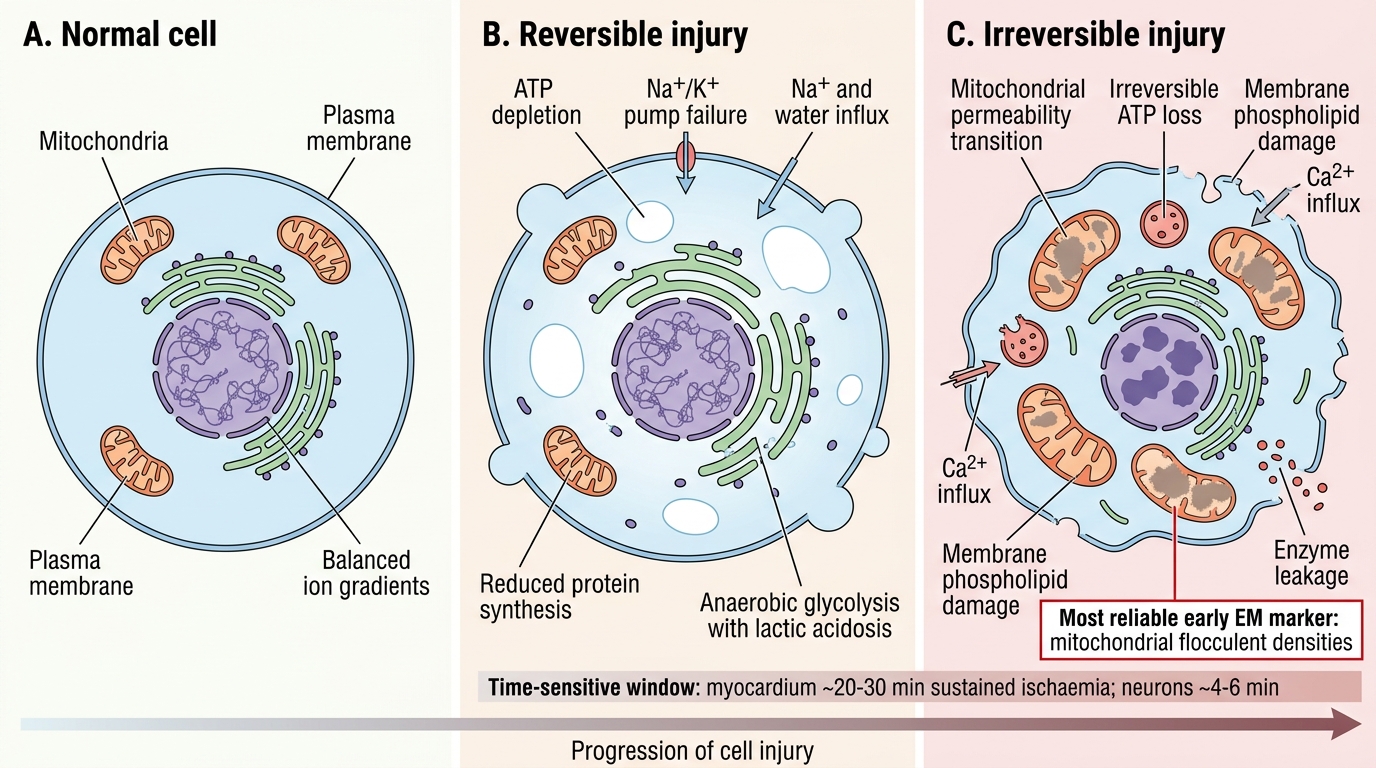
Reversible versus Irreversible Cell Injury
Clinical translation: the window between reversible and irreversible injury is time-sensitive. In myocardial ischaemia, irreversible cardiomyocyte injury begins at ~20–30 minutes of sustained ischaemia; in the brain, neurons begin to die within 4–6 minutes. This is why time is muscle and time is brain are clinical mantras.
SELF-CHECK
Which ultrastructural finding is considered the most reliable early marker of irreversible cell injury?
A. Dilatation of the endoplasmic reticulum
B. Detachment of ribosomes from rough ER
C. Large amorphous (flocculent) densities in mitochondrial matrix
D. Cytoplasmic vacuolation with increased cell volume
Reveal Answer
Answer: C. Large amorphous (flocculent) densities in mitochondrial matrix
Large amorphous (flocculent) densities within the mitochondrial matrix — corresponding to the mitochondrial permeability transition and precipitated proteins — are the hallmark EM marker of irreversible injury. Options A, B, and D (ER dilatation, ribosome detachment, cytoplasmic vacuolation/swelling) are all features of reversible injury and do not by themselves indicate that the cell has crossed the point of no return.
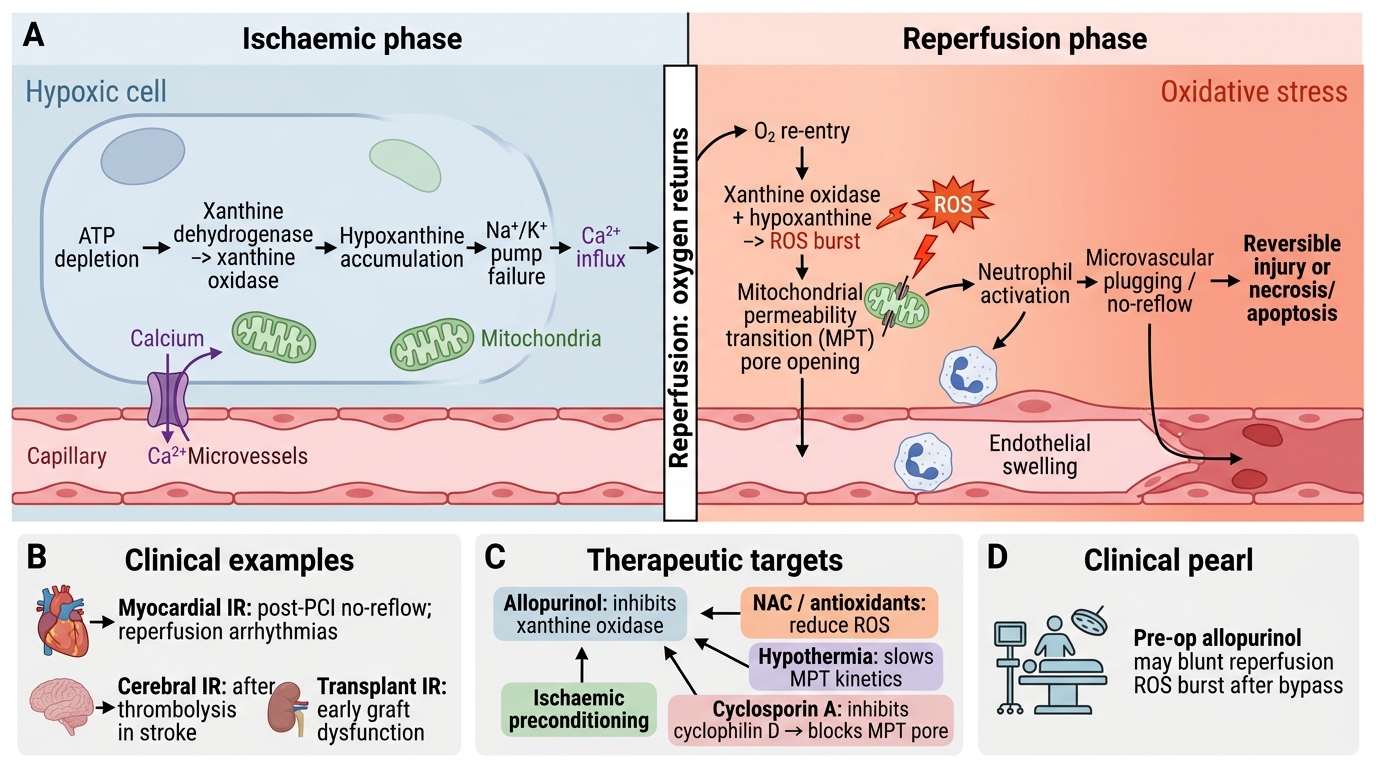
Ischaemia-Reperfusion Injury
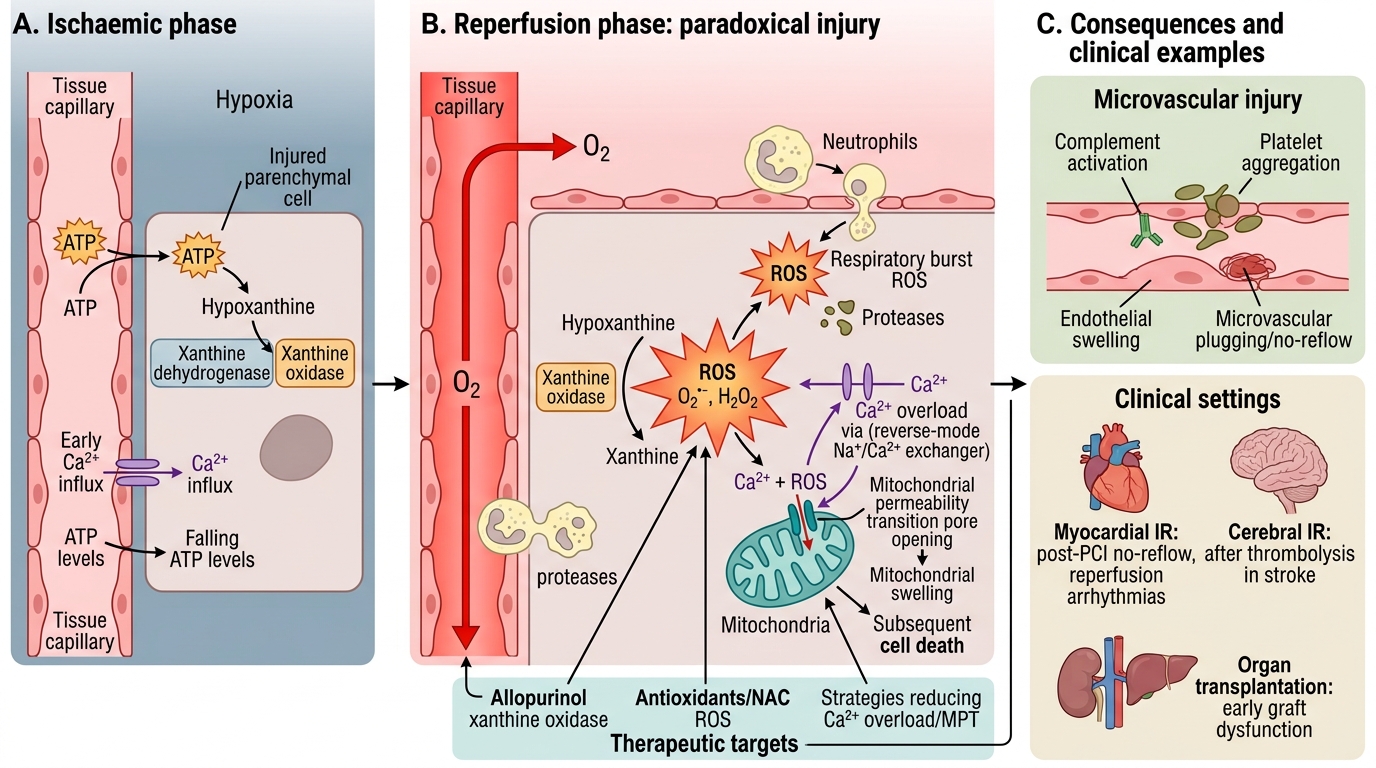
Mechanism of Ischaemia-Reperfusion Injury
Ischaemia-reperfusion (IR) injury is the paradox at the heart of the opening case: restoring blood flow to an ischaemic tissue can itself cause additional cell death beyond what ischaemia alone produced.
Why?
During ischaemia:
- Xanthine dehydrogenase is converted to xanthine oxidase.
- ATP catabolism produces hypoxanthine.
At reperfusion:
- Sudden O₂ delivery → xanthine oxidase converts hypoxanthine → xanthine + massive ROS burst (O₂•⁻ and H₂O₂).
- Simultaneously: (a) neutrophil infiltration (activated by ROS and complement) → respiratory burst adds more ROS + proteases; (b) Ca²⁺ overload (reverse-mode Na⁺/Ca²⁺ exchanger); (c) mitochondrial permeability transition (MPT) triggered by Ca²⁺ + ROS together; (d) complement and platelet activation → microvascular plugging.
Ischaemia-Reperfusion Injury Mechanism
Clinical examples:
- Myocardial IR: post-PCI no-reflow phenomenon; reperfusion arrhythmias.
- Cerebral IR: after thrombolysis in stroke.
- Organ transplantation: donor organ IR injury is a major cause of early graft dysfunction.
Therapeutic strategies targeting IR injury: antioxidants (NAC, allopurinol — inhibits xanthine oxidase), ischaemic preconditioning, hypothermia (slows MPT kinetics), cyclosporin A (inhibits cyclophilin D → blocks MPT pore).
CLINICAL PEARL
Allopurinol before cardiac surgery: some centres administer allopurinol pre-operatively to inhibit xanthine oxidase and blunt the reperfusion ROS burst when cardiopulmonary bypass is discontinued. This is a direct clinical application of the xanthine oxidase mechanism of IR injury — a pathway you can now trace from biochemistry to the operating theatre.
SELF-CHECK
A kidney is successfully transplanted after 18 hours of cold ischaemia. On reperfusion, the transplant team observes sluggish urine output and rising creatinine over the next 24 hours. The primary mechanism responsible is:
A. Acute T-cell mediated rejection against donor HLA antigens
B. Sudden ROS burst from xanthine oxidase activation causing tubular cell injury
C. Calcineurin inhibitor nephrotoxicity from cyclosporin induction
D. Hyperacute rejection from preformed antibodies
Reveal Answer
Answer: B. Sudden ROS burst from xanthine oxidase activation causing tubular cell injury
In ischaemia-reperfusion injury, the xanthine oxidase pathway generates a massive ROS burst on reperfusion, damaging tubular cells and endothelium — producing 'delayed graft function.' This is a biochemical, not immunological, mechanism. Acute T-cell rejection (A) typically manifests days–weeks later. Calcineurin inhibitor toxicity (C) is dose-dependent and later onset. Hyperacute rejection (D) would occur within minutes and is pre-screened by cross-matching.