Page 9 of 18
PA22.3-5 | Laboratory Panel Interpretation — SDL Guide
Learning Objectives
- Interpret a semen analysis panel using WHO criteria and recognise azoospermia, oligospermia and asthenospermia patterns.
- Interpret thyroid function tests (TSH, free T4/T3 ± anti-TPO) and distinguish primary, secondary and subclinical thyroid dysfunction.
- Interpret liver function tests by grouping them into hepatocellular injury, cholestatic and synthetic function markers, and classify jaundice as prehepatic, hepatic or posthepatic.
- Interpret renal function tests (urea, creatinine, eGFR, electrolytes) and distinguish acute kidney injury from chronic kidney disease using prerenal, renal and postrenal frameworks.
INSTRUCTIONS
A clinician who cannot read a lab panel cannot act on it. This module builds the systematic pattern-recognition skill you will use every day in medicine — from the fertility clinic to the ICU. Work through each panel type in order. When you hit a micro-quiz, stop and think before revealing the answer; the reasoning matters more than the result.
References
- Robbins & Kumar: Basic Pathology, 11th ed., Ch 18, 20, 21 (textbook)
- Harsh Mohan: Textbook of Pathology, 8th ed., Ch 23 (textbook)
- WHO Laboratory Manual for Examination of Human Semen, 6th ed. (2021) (guideline)
- EASL Clinical Practice Guidelines on Liver Disease (2022) (guideline)
Version 2.0 | NMC CBUC 2024
CLINICAL SCENARIO
A 28-year-old couple presents after 18 months of unprotected intercourse without conception. The semen analysis report on the desk shows: volume 0.9 mL, concentration 8 × 10⁶/mL, total motility 24%, progressive motility 18%, normal morphology 3%. Before you can counsel them, you need to know which WHO thresholds have been crossed and what combination of defects this represents. By the end of this module you will not only answer that question — you will be able to do the same for thyroid, liver and renal panels.
WHY THIS MATTERS
Pathology practical exams routinely include panel interpretation as a short-answer or structured-clinical question. More importantly, interpreting panels is a core clinical skill: a misread TFT leads to wrong thyroid medication dosing; a missed hepatocellular-vs-cholestatic pattern delays diagnosis; failure to recognise the urea:creatinine ratio can mean treating a surgical obstruction with IV fluids alone. These are Year-2 competencies directly assessed in university examinations (PA22.3–22.5).
RECALL
Before starting, recall:
• The liver produces albumin and clotting factors (prothrombin). Which of these is affected earliest in synthetic failure?
• The kidney filters creatinine freely but does not reabsorb it, whereas urea is partially reabsorbed. What does this mean for their ratio when tubular flow is slow?
• Thyroid hormone synthesis requires iodine + thyroid peroxidase. TSH from the pituitary is suppressed by rising T4 via negative feedback. If the thyroid gland fails, what happens to TSH?
Hold these in mind as you work through the panels.
How to Read Any Panel: Universal Principles
Universal Principles for Reading Any Lab Panel
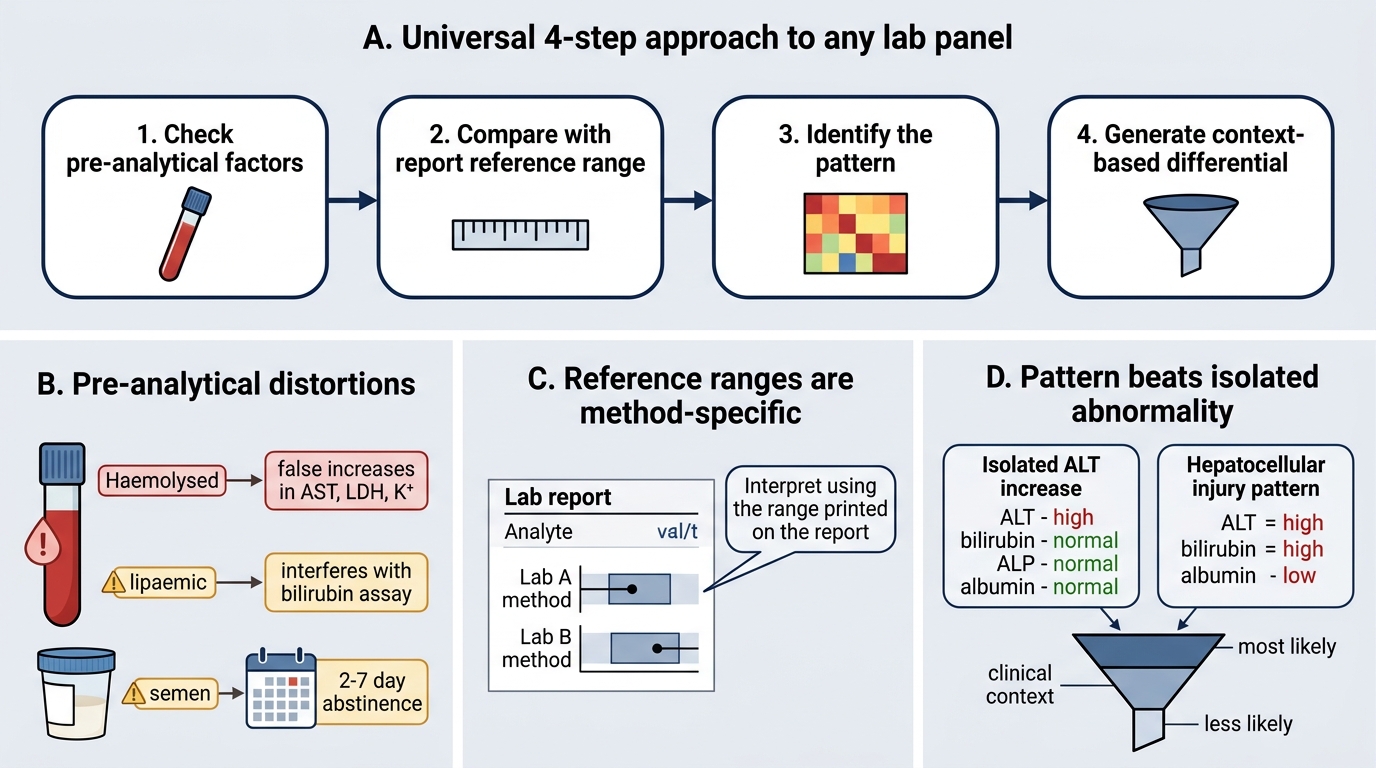
Every lab panel interpretation follows four steps:
- Check pre-analytical factors first. Haemolysis raises LDH, K⁺ and AST falsely. Lipaemia interferes with bilirubin assays. Semen specimens must be collected after 2–7 days of abstinence; a shorter interval reduces volume and count, a longer interval reduces motility.
- Compare each value against the reference range provided on the report — ranges vary by method and laboratory. Never memorise absolute numbers without their context.
- Identify the pattern, not just the single abnormal value. A lone ↑ALT with normal bilirubin, ALP and albumin is very different from ↑ALT + ↑bilirubin + ↓albumin.
- Generate a differential ordered by probability in the clinical context.
Pre-analytical factors that commonly distort panels:
| Factor | Panel affected | Direction of error |
|---|---|---|
| Haemolysed sample | LFT (AST, LDH, K⁺) | False ↑ |
| Semen: abstinence <2 d | Semen analysis (count, volume) | False ↓ |
| Semen: abstinence >7 d | Semen analysis (motility) | False ↓ |
| Biotin supplementation | TFT (immunoassay interference) | False ↓ TSH / ↑ T4 |
| Recent heavy meal | Triglycerides, ALP | False ↑ |
Semen Analysis — WHO 2021 Reference Limits
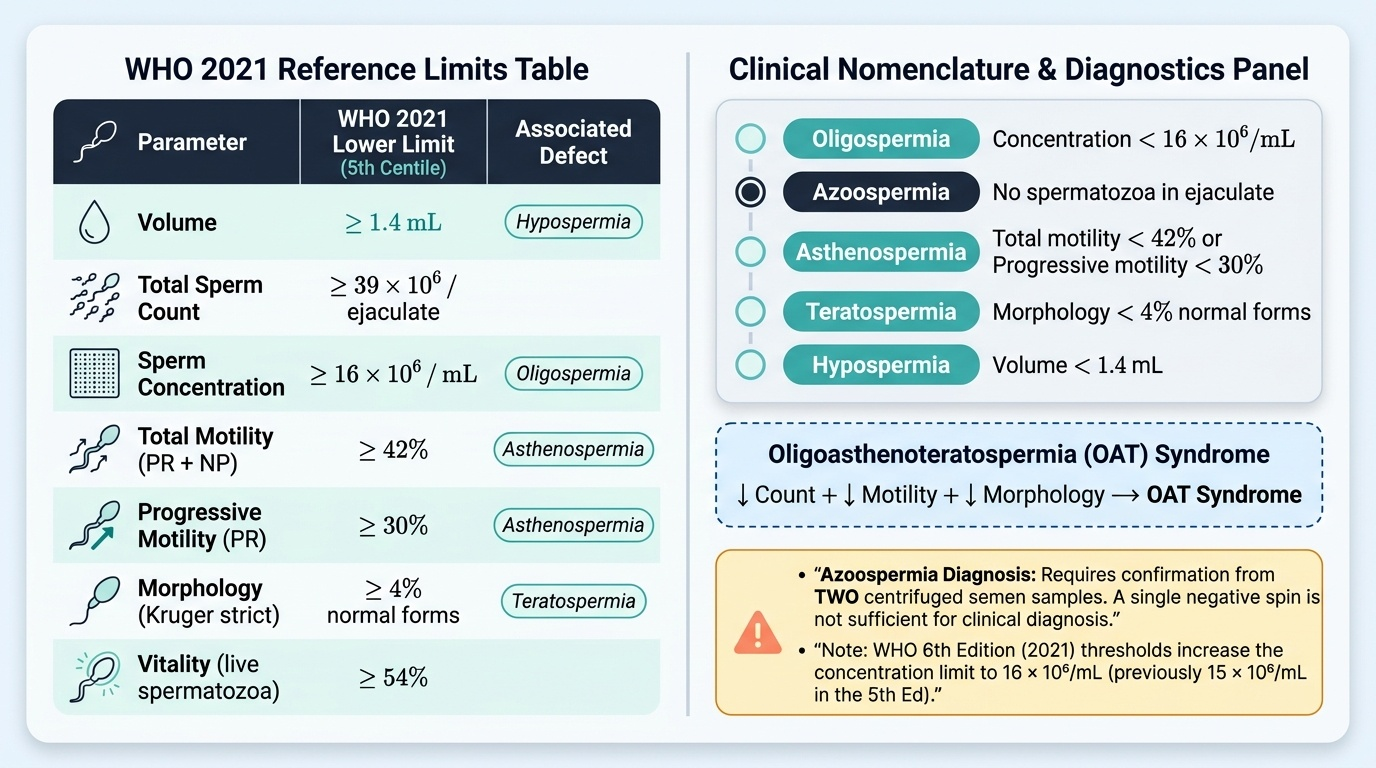
The WHO 6th edition (2021) provides the following lower reference limits (5th centile of fertile men):
Provided image
| Parameter | Lower reference limit |
|---|---|
| Volume | 1.4 mL |
| Total sperm count | 39 × 10⁶/ejaculate |
| Sperm concentration | 16 × 10⁶/mL |
| Total motility (PR + NP) | 42% |
| Progressive motility (PR) | 30% |
| Morphology (Kruger strict) | 4% |
| Vitality (live spermatozoa) | 54% |
IMPORTANT NOTE: The WHO 5th edition (2010) figures are still widely quoted in older Indian textbooks. The 6th edition thresholds differ — notably concentration drops from 15 to 16 × 10⁶/mL and normal morphology rises from 4% to 4% (unchanged). Always state which edition you are applying.
Nomenclature for defects:
• Oligospermia — concentration < 16 × 10⁶/mL
• Azoospermia — no spermatozoa in the ejaculate (obstructive vs non-obstructive)
• Asthenospermia — total motility < 42% or progressive motility < 30%
• Teratospermia — morphology < 4% normal forms
• Hypospermia — volume < 1.4 mL
• Oligoasthenoteratospermia (OAT) — combined defect in count + motility + morphology
Worked example — the hook scenario:
- Volume 0.9 mL → below 1.4 mL → hypospermia
- Concentration 8 × 10⁶/mL → below 16 → oligospermia
- Total motility 24% → below 42% → asthenospermia
- Morphology 3% → below 4% → teratospermia
- Combined: OAT syndrome with hypospermia
Possible causes: varicocele (most common reversible cause), partial ejaculatory duct obstruction (explains low volume), or primary testicular failure.
IMPORTANT NOTE: Azoospermia requires two centrifuged semen samples before the diagnosis is confirmed — a single negative spin is not sufficient.
SELF-CHECK
A 32-year-old man's semen analysis shows: volume 2.8 mL, concentration 22 × 10⁶/mL, total motility 28%, progressive motility 20%, normal morphology 6%. Which single defect classification best describes this report?
A. Oligospermia only
B. Asthenospermia only
C. OAT syndrome
D. Azoospermia
Reveal Answer
Answer: B. Asthenospermia only
Volume is normal (2.8 mL ≥ 1.4 mL). Concentration is normal (22 × 10⁶/mL ≥ 16). Morphology is normal (6% ≥ 4%). Only motility is reduced: total 28% < 42% and progressive 20% < 30%. This is isolated asthenospermia. OAT requires defects in all three axes (count + motility + morphology). Azoospermia means no sperm.
Thyroid Function Tests — Patterns and Interpretation
The standard TFT panel includes: TSH (thyroid-stimulating hormone), free T4 (FT4), free T3 (FT3), and optionally anti-thyroid peroxidase antibodies (anti-TPO Ab).
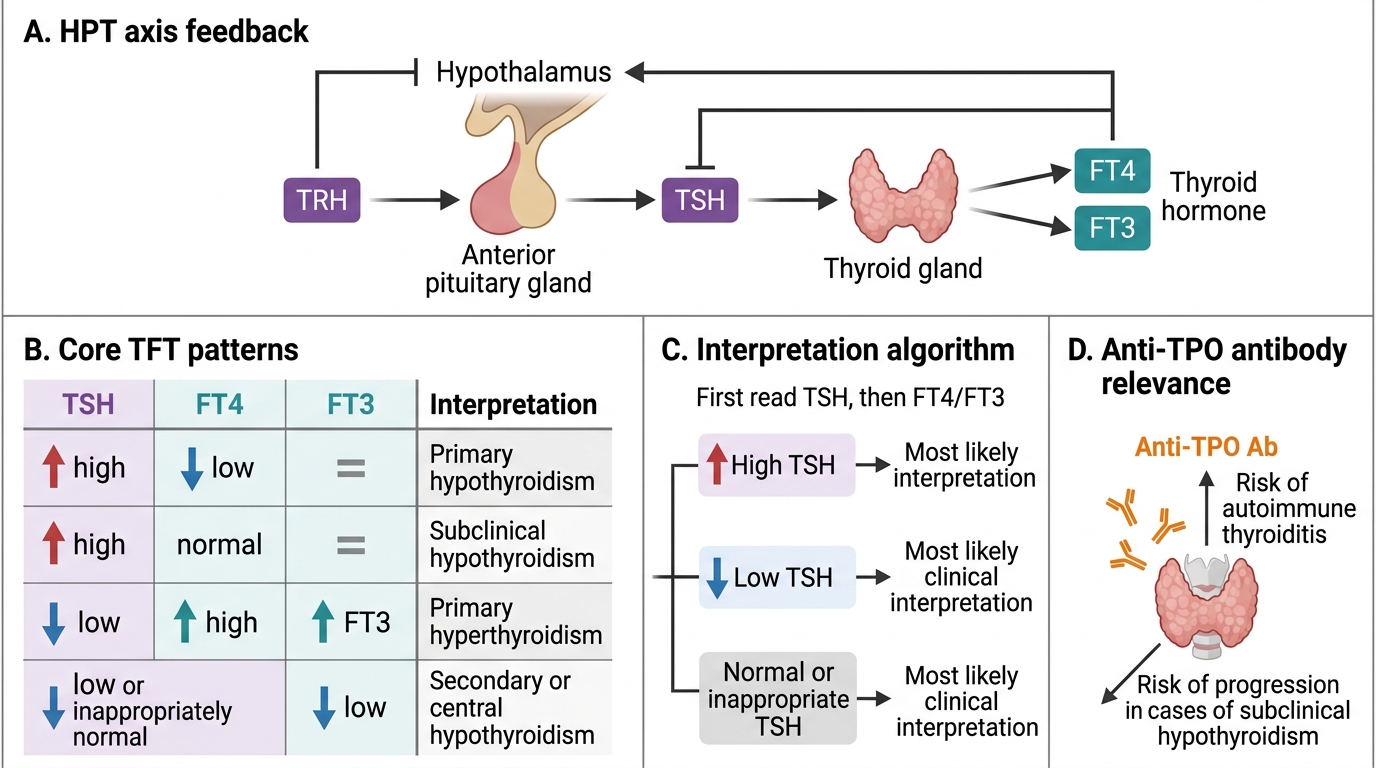
The hypothalamic–pituitary–thyroid axis operates as a closed-loop feedback system: TSH drives T4/T3 synthesis; rising T4/T3 suppresses TSH. This inverse TSH–T4 relationship is the basis of all TFT interpretation.
Core patterns:
| Pattern | TSH | FT4 | FT3 | Comment |
|---|---|---|---|---|
| Primary hypothyroidism | ↑↑ | ↓ | ↓ | Thyroid fails → pituitary over-drives |
| Subclinical hypothyroidism | ↑ | Normal | Normal | Compensated; anti-TPO predicts progression |
| Primary hyperthyroidism | ↓ (often undetectable) | ↑ | ↑ | Excess thyroid hormone suppresses TSH |
| Subclinical hyperthyroidism | ↓ | Normal | Normal | Autonomously functioning nodule, early Graves' |
| Secondary hypothyroidism | ↓ or low-normal | ↓ | ↓ | Pituitary/hypothalamic disease; TSH does NOT rise despite low T4 |
| Sick euthyroid / non-thyroidal illness | ↓ or normal | Normal or ↓ | ↓↓ | Critical illness suppresses T3 conversion |
Anti-TPO antibodies:
- Present in ~90% of Hashimoto's thyroiditis (most common cause of primary hypothyroidism in iodine-sufficient populations).
- Present in ~75% of Graves' disease.
- A positive anti-TPO in subclinical hypothyroidism predicts a 4% annual risk of progressing to overt hypothyroidism — this changes the decision to treat.
Worked example:
> TSH 28 mIU/L (ref 0.4–4.0), FT4 6.2 pmol/L (ref 12–22), anti-TPO 890 IU/mL (ref < 35)
> Interpretation: markedly elevated TSH, low FT4 — overt primary hypothyroidism. High anti-TPO confirms autoimmune (Hashimoto's) aetiology. Start levothyroxine.
IMPORTANT NOTE: TSH alone is the best single test for screening. But TSH alone is insufficient when pituitary disease is suspected — you MUST request FT4 as well, because in secondary hypothyroidism TSH is inappropriately low-normal despite low T4.
⚑ AI image — pending faculty review (auto-QA score 7/10; best of 3 attempts)
Thyroid Function Tests: Patterns and Interpretation
SELF-CHECK
A 45-year-old woman with fatigue and weight gain has TSH 0.3 mIU/L (ref 0.4–4.0) and FT4 8.1 pmol/L (ref 12–22). Anti-TPO is negative. What is the most likely diagnosis?
A. Primary hypothyroidism with Hashimoto's thyroiditis
B. Secondary (central) hypothyroidism
C. Subclinical hyperthyroidism
D. Sick euthyroid syndrome
Reveal Answer
Answer: B. Secondary (central) hypothyroidism
The key finding is low-normal TSH (0.3 — borderline suppressed) with low FT4. In primary hypothyroidism the failing thyroid would drive TSH up sharply (↑↑TSH ↓T4). Here TSH is NOT elevated despite very low FT4 — this dissociation indicates the pituitary cannot respond normally, pointing to secondary (central) hypothyroidism from pituitary or hypothalamic disease. Anti-TPO negative is consistent (Hashimoto's produces high TSH). Further investigation: pituitary MRI + other anterior pituitary hormones.