Page 7 of 34
PA26.6 | Ischaemic Heart Disease & Acute Coronary Syndromes — SDL Guide (Part 2)
Gross and Microscopic Evolution of Myocardial Infarction
Evolution of Myocardial Infarction
The pathological evolution of MI is one of the most examined topics in Year-2 pathology. Learn this timeline precisely — examiners routinely ask 'what do you see on microscopy at day 4?'
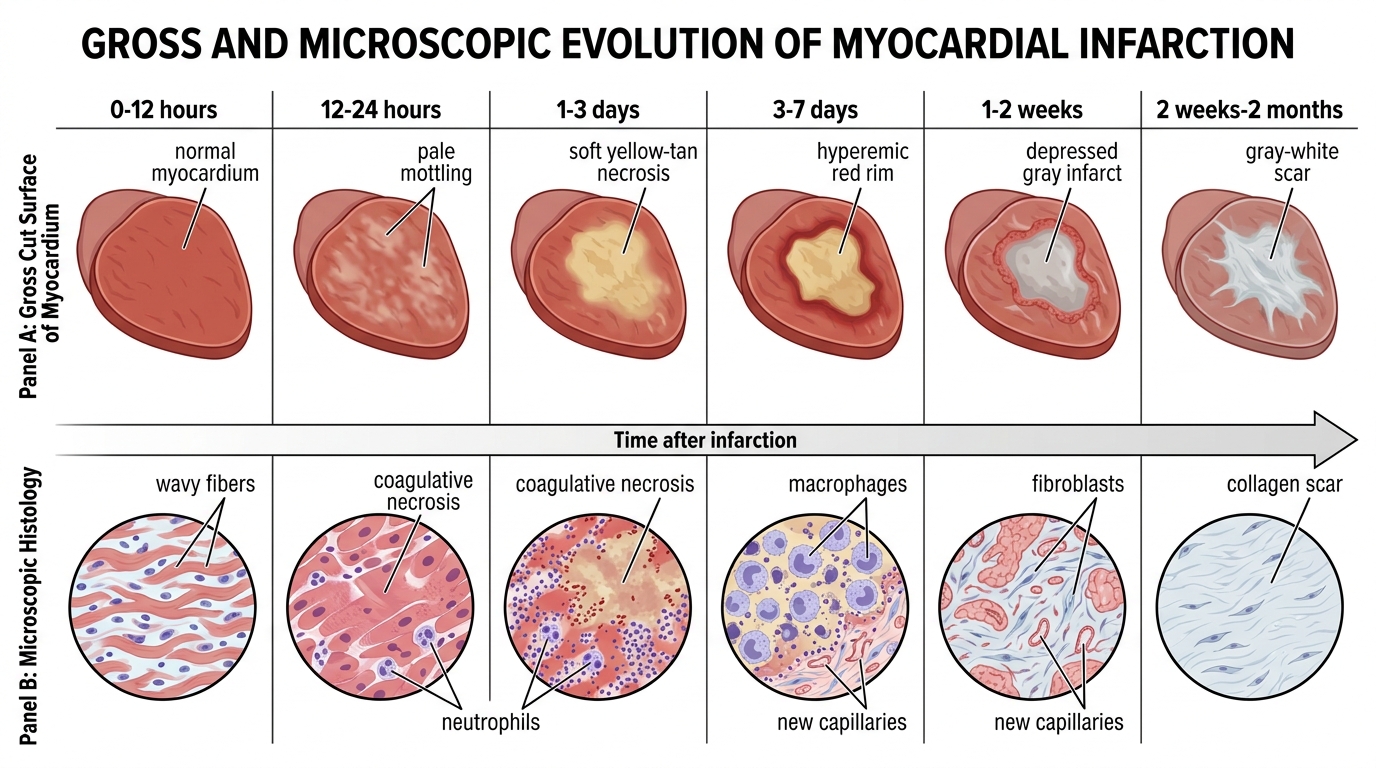
GROSS changes:
| Timeframe | Gross Appearance |
|---|---|
| 0–12 hours | Normal (no visible change) |
| 12–24 hours | Pale/mottled area; may be slightly soft |
| 1–3 days | Pale yellow/tan necrotic area; soft, friable |
| 3–7 days | Yellow–tan centre; hyperaemic border (red rim) from inflammatory infiltration |
| 1–2 weeks | Depressed, pale grey area surrounded by vascularised granulation tissue (reddish rim) |
| 2 weeks–2 months | Progressive collagen scar formation; firm, grey–white scar |
MICROSCOPIC changes:
| Timeframe | Microscopic Findings |
|---|---|
| 0–12 hours | No light-microscopic changes OR wavy fibres (early stretching of necrotic myocytes adjacent to viable myocardium) |
| 12–24 hours | Coagulative necrosis begins — pyknotic nuclei, eosinophilic cytoplasm, loss of cross-striations; contraction band necrosis (hypereosinophilic transverse bands in myocytes) |
| 1–3 days | Prominent neutrophilic infiltration (PMN infiltrate peaks ~day 2–3) |
| 3–7 days | PMNs dying; macrophages arrive and begin phagocytosis of dead myocytes; early granulation tissue at margins |
| 1–2 weeks | Granulation tissue with capillary proliferation and fibroblast infiltration replaces necrotic zone |
| >2 weeks–2 months | Dense collagen scar — acellular, avascular; complete scar maturation by 6–8 weeks |
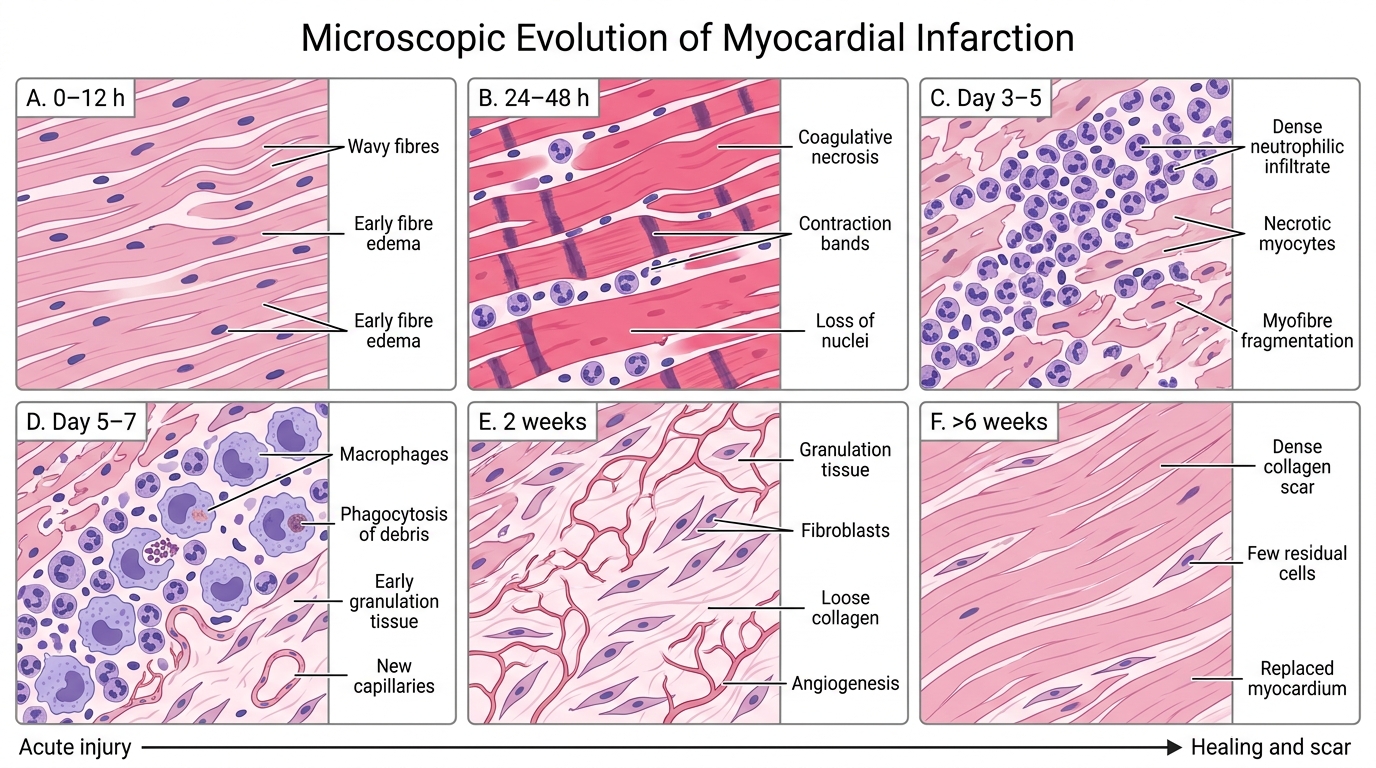
Microscopic Evolution of Myocardial Infarction
High-yield pearl: Contraction band necrosis (hypercontracted sarcomeres producing eosinophilic transverse bands) is the hallmark of reperfusion injury — it is seen when infarcted myocardium is re-exposed to calcium-rich blood after thrombolysis or PCI. It also occurs at the edges of any infarct even without reperfusion.
SELF-CHECK
On autopsy, the left ventricle of a 68-year-old man shows a pale yellow-tan central zone with a hyperaemic red rim. Microscopically, the zone shows abundant macrophages engulfing cellular debris with no neutrophils remaining. What is the most likely age of this infarct?
A. 6–12 hours
B. 1–3 days
C. 3–7 days
D. 2–4 weeks
Reveal Answer
Answer: C. 3–7 days
The combination of yellow-tan gross appearance with a hyperaemic rim AND macrophage-predominant infiltrate (phagocytosis of dead myocytes, no residual neutrophils) is characteristic of days 3–7. Neutrophils peak at days 1–3 then die, and macrophages begin clearing debris by day 3–4. After 1 week, granulation tissue begins to form. Six-to-twelve hours shows no or only early changes. Two-to-four weeks would show granulation tissue or early scar.
Reperfusion Injury and Contraction Band Necrosis
Reperfusion Injury and Contraction Band Necrosis
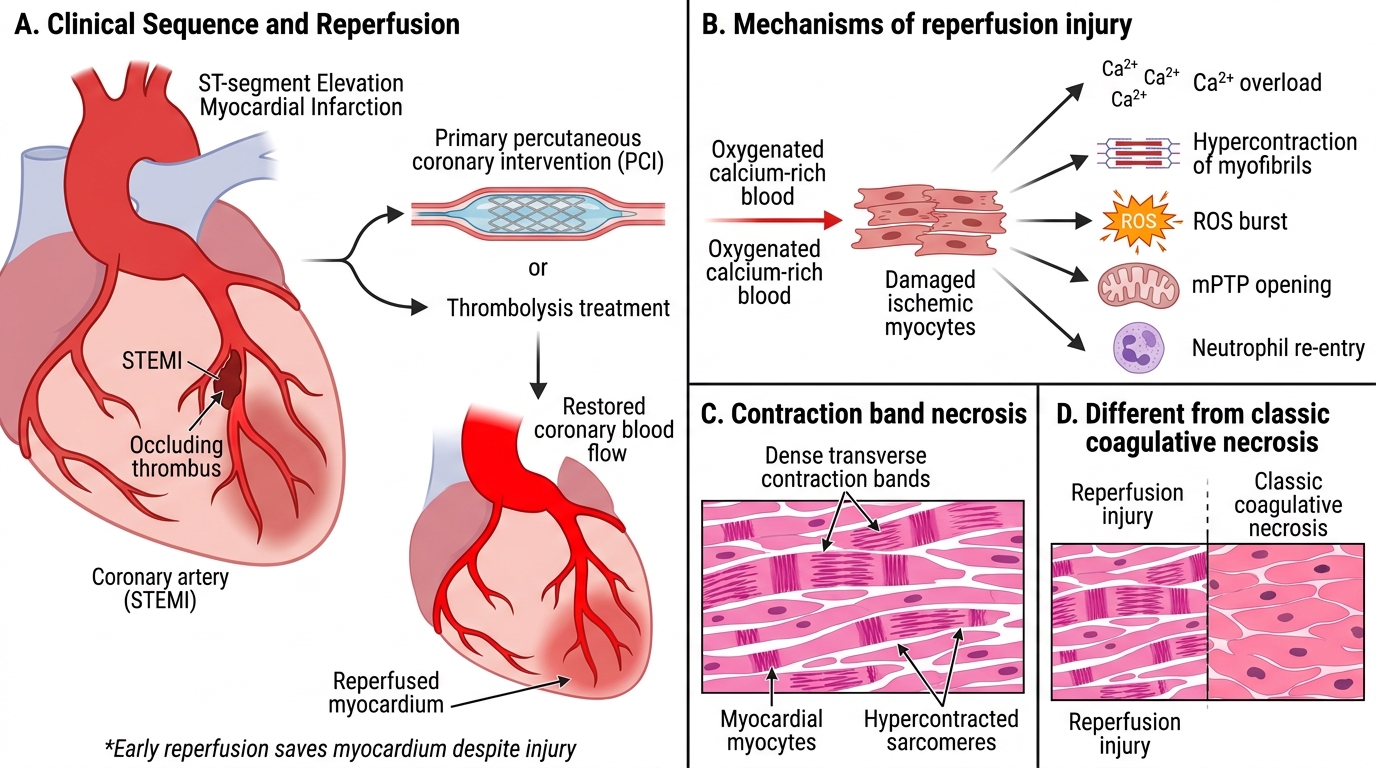
Modern management of STEMI aims to restore coronary flow as rapidly as possible — by primary PCI (percutaneous coronary intervention) or thrombolysis. Paradoxically, reperfusion itself causes additional myocyte death — this is reperfusion injury.
Mechanism of reperfusion injury:
1. Sudden restoration of calcium-rich oxygenated blood to ischaemic cells that have lost membrane integrity
2. Calcium overload → hypercontraction of myofibrils → contraction band necrosis
3. Restoration of mitochondrial electron transport → burst of reactive oxygen species (ROS) → oxidative damage
4. Paradoxical opening of the mitochondrial permeability transition pore (mPTP) → mitochondrial swelling and apoptosis
5. Re-entry of neutrophils from reperfused vessels → further inflammatory damage
Pathological hallmark: Contraction band necrosis — dense, intensely eosinophilic transverse bands (hypercontracted sarcomeres) within myocytes, seen within hours of reperfusion. This is distinct from the pyknotic nuclei and uniform eosinophilia of classic coagulative necrosis.
Net benefit: Despite reperfusion injury, early reperfusion dramatically reduces infarct size and mortality. The goal remains: 'door-to-balloon' (D2B) ≤ 90 minutes for STEMI.
SELF-CHECK
Which microscopic finding is the PATHOLOGICAL HALLMARK of myocardial reperfusion injury following thrombolysis for STEMI?
A. Coagulative necrosis with pyknotic nuclei and uniform eosinophilia
B. Dense neutrophilic infiltrate within necrotic myocardium
C. Hypereosinophilic transverse bands within myocytes (contraction band necrosis)
D. Granulation tissue with new capillary formation
Reveal Answer
Answer: C. Hypereosinophilic transverse bands within myocytes (contraction band necrosis)
Contraction band necrosis — intensely eosinophilic transverse bands formed by hypercontracted sarcomeres — is the hallmark of reperfusion injury. It results from calcium overload when calcium-rich blood suddenly re-enters ischaemic cells with compromised membranes. Coagulative necrosis (option A) is the basic change in any infarct but is not specific to reperfusion. Neutrophilic infiltrate peaks at 1–3 days in any MI. Granulation tissue is a 1–2 week finding.
Cardiac Biomarkers in ACS
Cardiac Biomarkers in Acute Coronary Syndrome
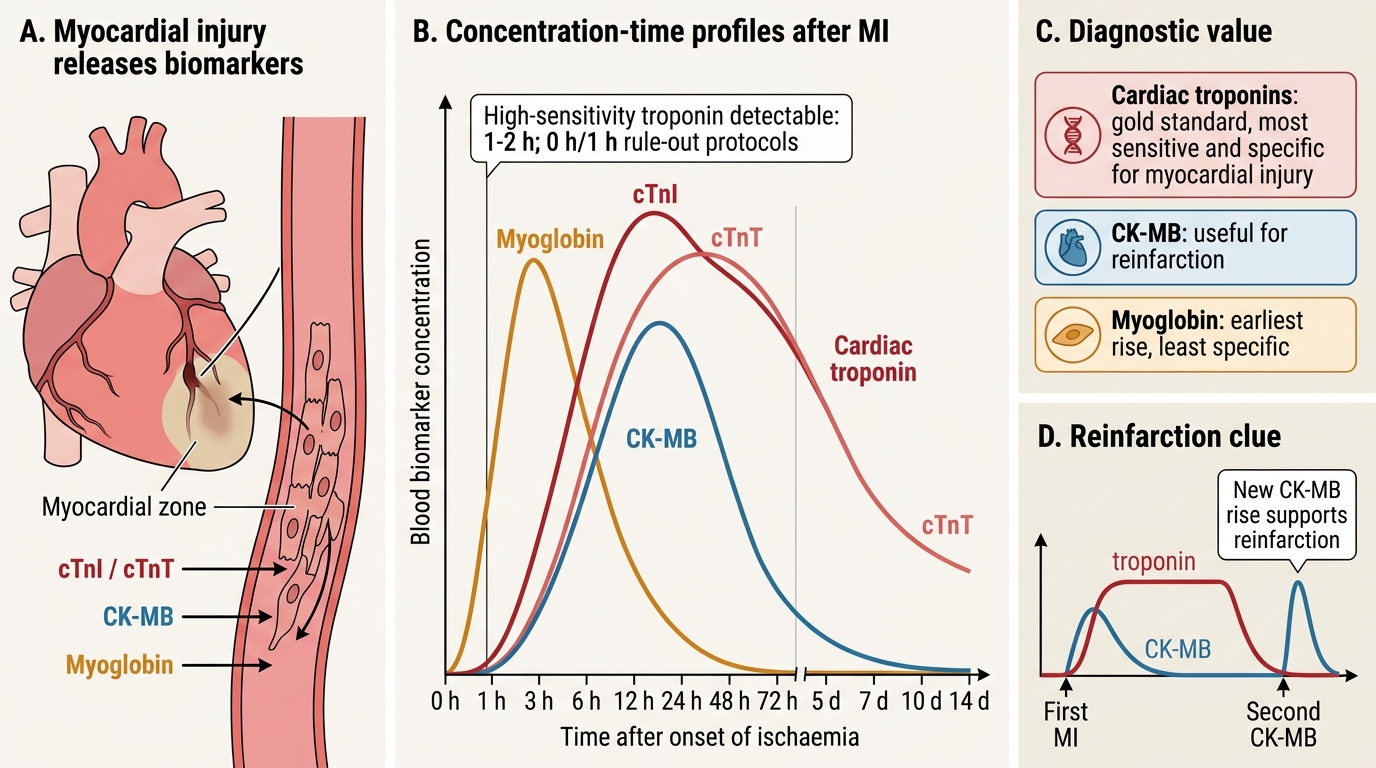
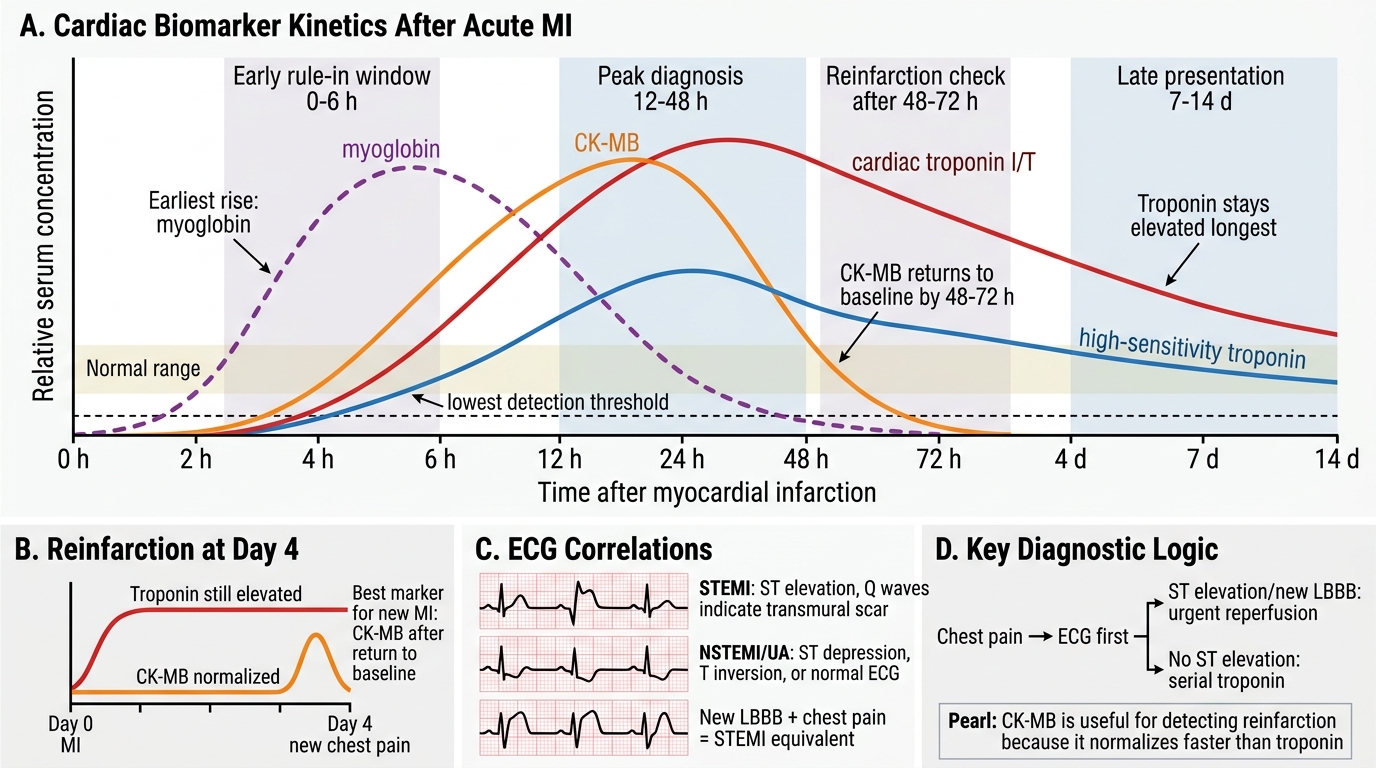
Cardiac biomarkers are proteins released into blood when myocardial cells are injured or die. Their concentration–time profiles allow clinicians to diagnose MI, estimate infarct size, and time the event.
Cardiac Troponins (cTnI and cTnT) — the gold standard:
Troponin I and T are regulatory proteins of the myocardial contractile apparatus. They are expressed exclusively in cardiac muscle (cardiac-specific isoforms), making them the most sensitive and specific biomarkers for myocardial injury.
- Rise: 3–6 hours after onset of ischaemia
- Peak: 12–24 hours (cTnI), 12–48 hours (cTnT)
- Return to normal: 5–7 days (cTnI), 10–14 days (cTnT) — cTnT stays elevated longer, useful for late presentations
- High-sensitivity troponin (hs-TnI/hs-TnT) can detect injury within 1–2 hours; used in 0h/1h rule-out protocols
CK-MB (Creatine Kinase — MB isoform):
- Rise: 4–8 hours
- Peak: 10–24 hours
- Return to normal: 48–72 hours — returns to baseline faster than troponin
- Clinically useful for: Detecting reinfarction — if a second MI occurs while troponin is still elevated from the first, a new troponin rise is hard to detect; a new CK-MB rise (after its return to baseline) confirms reinfarction
- Less specific than troponin (CK-MB present in skeletal muscle, though in much lower proportion)
Myoglobin:
- Earliest to rise: 1–3 hours
- Returns to normal: 24 hours
- Least specific (present in all muscle)
- Historical role as an early 'rule-out' test — largely replaced by high-sensitivity troponin
Cardiac Biomarker Kinetics After Myocardial Infarction
ECG correlations:
- STEMI: ST elevation in the territory of the occluded artery, followed by T-wave inversion and pathological Q waves (>40 ms, >25% of R wave height) — Q waves indicate transmural scar
- NSTEMI/UA: ST depression, T-wave inversion, or a normal ECG (no Q waves)
- New LBBB in the context of chest pain is treated as a STEMI equivalent
SELF-CHECK
A 58-year-old man is brought to the emergency department 10 hours after onset of crushing chest pain. His troponin I is significantly elevated. He was treated with thrombolysis and discharged. He re-presents 4 days later with new chest pain. His troponin I is again elevated. Which biomarker would most reliably CONFIRM a new (second) MI in this setting?
A. Repeat troponin I — a further rise from the current elevated level
B. Myoglobin level
C. CK-MB level (after it has returned to baseline from the first MI)
D. High-sensitivity troponin T
Reveal Answer
Answer: C. CK-MB level (after it has returned to baseline from the first MI)
CK-MB returns to baseline within 48–72 hours. By day 4, CK-MB from the first MI has normalised. A new CK-MB elevation therefore reliably indicates a new MI, even while troponin (which stays elevated 10–14 days for cTnT, 5–7 days for cTnI) remains elevated from the first event. This is the classic clinical utility of CK-MB over troponin for reinfarction detection.
CLINICAL PEARL
Troponin ≠ MI — it means myocardial injury. Troponin elevation occurs in: pulmonary embolism, myocarditis, sepsis, renal failure (impaired clearance), cardiac contusion, heart failure, and after cardioversion. The clinical context (history, ECG, imaging) determines whether the injury is ischaemic (MI) or non-ischaemic. A troponin rise in isolation never makes the diagnosis of MI — the 4th Universal Definition of MI requires both a troponin rise AND fall plus clinical evidence of ischaemia.