Page 18 of 26
PA31.{5,7} | Diabetes Mellitus & Pancreatic Cancer — SDL Guide (Part 4)
Islet Morphology in Diabetes — A Synthesis
The islet changes differ between T1DM and T2DM and reflect their different pathophysiological mechanisms:
Type 1 DM — islet morphology:
- Insulitis: Dense lymphocytic infiltrate (CD8⁺ T cells, CD4⁺ T cells, macrophages) within and around islets — seen in early/active disease
- β-cell depletion: Progressive reduction in islet size and β-cell number; α, δ, PP cells are relatively spared → at end-stage, islets are small fibrotic remnants
- Lymphocytic infiltrate may be absent in long-standing T1DM (burnt-out phase) — islets simply appear atrophic and fibrotic
Type 2 DM — islet morphology:
- Islet amyloid deposition: The most characteristic finding; amyloid derived from IAPP (islet amyloid polypeptide = amylin), co-secreted with insulin; deposits first in the subendothelial space, eventually replacing much of the islet
- PAS-positive, Congo-red positive with apple-green birefringence under polarised light
- Degree of amyloid correlates with severity and duration of T2DM
- Reduced β-cell mass: ~50–60% reduction compared to non-diabetic subjects of similar age and BMI
- No insulitis — the islets are not inflamed
- Lipogenic changes in pancreatic parenchyma (fatty replacement, lipomatosis) — correlates with visceral obesity
A practical examination table:
| Morphological feature | T1DM | T2DM |
|---|---|---|
| Insulitis | Present (early) | Absent |
| β-cell depletion | Severe, total | Moderate (~50%) |
| Islet amyloid (IAPP) | Absent | Present (characteristic) |
| α, δ cells | Spared | Relatively spared |
| Fibrosis | Variable | Variable |
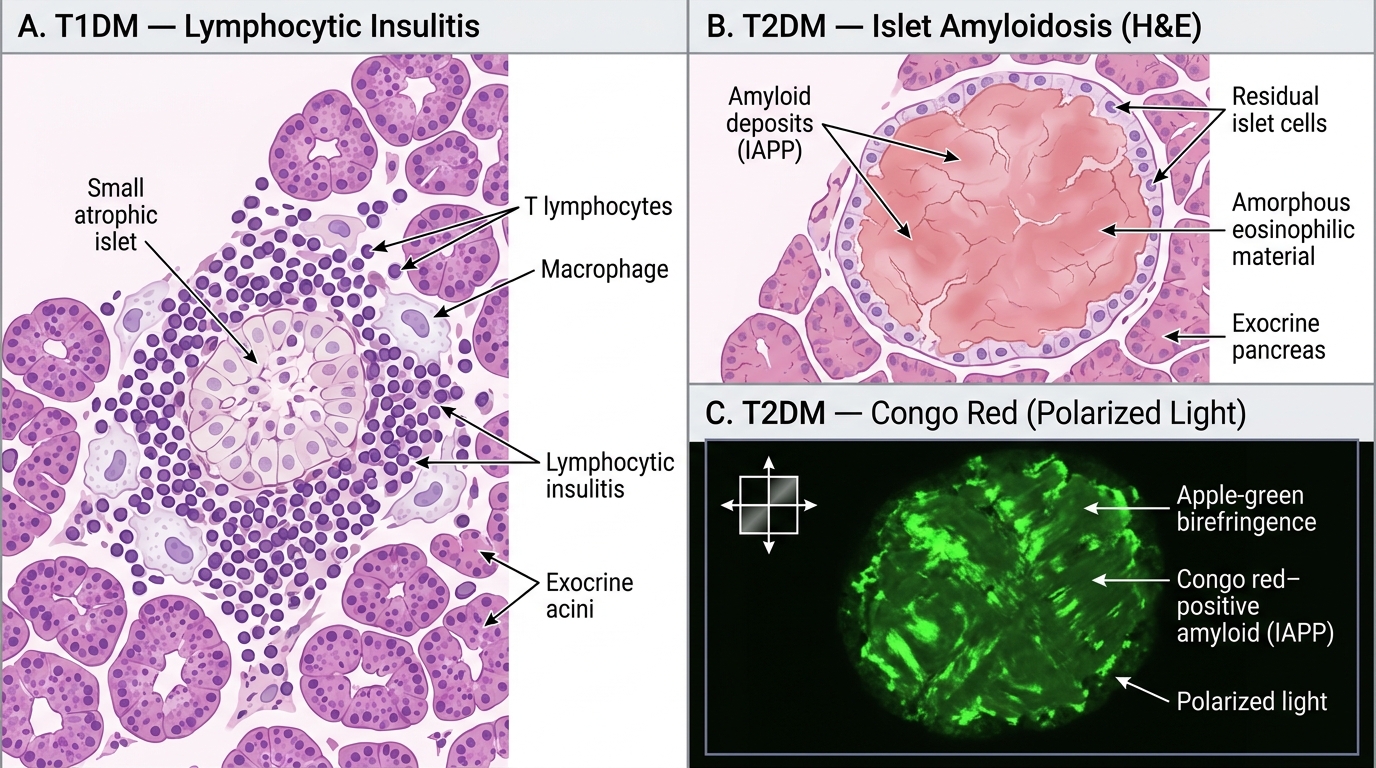
Islet Histopathology in T1DM vs T2DM — H&E and Congo Red
Pancreatic Cancer — Etiology, Risk Factors, and Molecular Pathogenesis
Pancreatic ductal adenocarcinoma (PDAC) accounts for >90% of all pancreatic cancers and is the third most common cause of cancer death in India. The 5-year survival rate is < 10% — largely because the tumour is biologically aggressive and anatomically silent until advanced.
Epidemiology and risk factors:
- Median age at diagnosis: 70–72 years; rare <40 years
- Male:female ratio approximately 1.5:1
- Major modifiable risk factors:
- Cigarette smoking — doubles the risk; ~25% of cases attributable; carcinogens in tobacco reach the pancreatic duct via bile reflux
- Chronic pancreatitis (especially hereditary and tropical pancreatitis) — 5× increased risk; chronic inflammation → epithelial regeneration → DNA damage → dysplasia
- Type 2 diabetes mellitus — modestly increased risk (~2×); causal direction partially bidirectional (new-onset DM may be caused by the cancer)
- Obesity (BMI >30 kg/m²) — ~1.5× risk; mechanism through hyperinsulinaemia and adipokines
- Alcohol (heavy use) — indirectly via chronic pancreatitis
- High-fat, red/processed meat diet; low vegetable/fruit intake
- Hereditary risk (10% of cases): BRCA2 mutation (most common hereditary risk gene for PDAC), Lynch syndrome (mismatch repair genes), hereditary pancreatitis (PRSS1, SPINK1 mutations), Peutz-Jeghers syndrome (STK11), familial atypical multiple mole melanoma (FAMMM — CDKN2A/p16)
Molecular pathogenesis — the four driver mutations (Robbins sequence):
PDAC arises through an orderly accumulation of mutations, mirroring the adenoma-carcinoma sequence in colorectal cancer:
- KRAS oncogene (codon 12, G12D/G12V) — mutated in >90% of PDAC; the earliest and most prevalent mutation; activates RAS-MAPK and PI3K-AKT proliferation pathways; provides constitutive growth signal
- p16/CDKN2A tumour suppressor — lost in ~95% of PDAC (deletion or promoter methylation); normally inhibits CDK4/6 → Rb phosphorylation → G1/S cell-cycle arrest; loss removes the brake on cell-cycle progression
- TP53 tumour suppressor — mutated in ~70–75% of PDAC; point mutations accumulate as a late event (PanIN-3 and beyond); loss of p53 → genome instability, failure of DNA damage response, resistance to apoptosis
- SMAD4 (DPC4) tumour suppressor — deleted in ~55% of PDAC; a mediator of TGF-β signalling; TGF-β normally inhibits epithelial cell growth; loss of SMAD4 converts TGF-β from tumour suppressor to tumour promoter (promotes EMT and invasion); loss of SMAD4 predicts poor prognosis and widespread metastasis
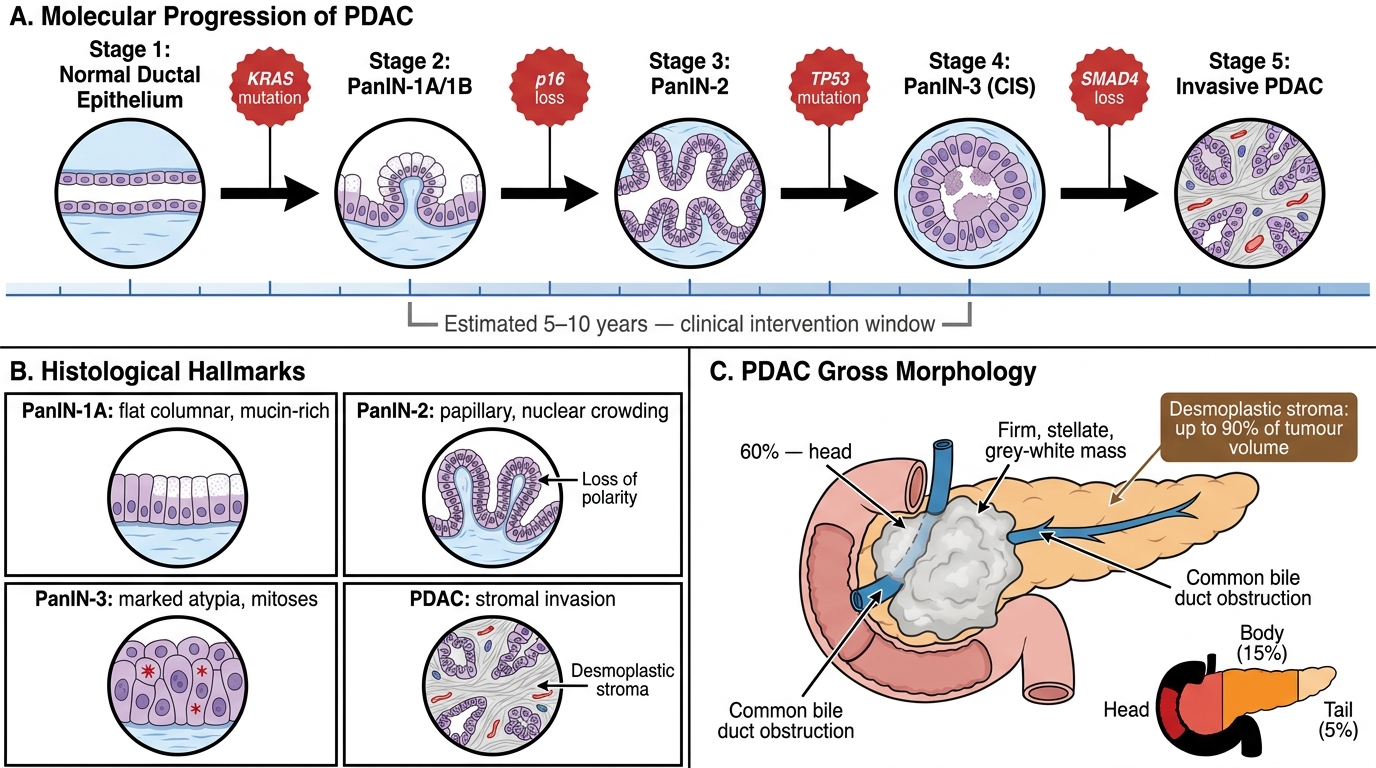
KRAS-Driven Molecular Progression from Normal Ductal Epithelium to Invasive PDAC
PanIN Precursor Lesion, Gross and Microscopic Morphology
Pancreatic Intraepithelial Neoplasia (PanIN) is the recognised precursor lesion of PDAC, analogous to colonic adenoma:
- PanIN-1A: Flat columnar epithelium with basal nuclei, mucin-rich cytoplasm, no dysplasia; KRAS mutant
- PanIN-1B: Same cytology but micropapillary architecture
- PanIN-2: Papillary epithelium with nuclear crowding, loss of polarity, mild nuclear atypia; p16 loss
- PanIN-3 (Carcinoma in situ): Marked nuclear atypia, loss of polarity, luminal necrosis, mitoses; TP53 mutation; histologically indistinguishable from PDAC except for absence of stromal invasion
PanIN-3 → invasive PDAC is estimated to take 5–10 years — the window for intervention that is currently missed clinically.
Gross morphology of PDAC:
- Location: 60% in the head of the pancreas, 15% in the body, 5% in the tail, 20% diffuse
- Head tumours present earlier (biliary obstruction) than body/tail tumours (which are silent → larger at diagnosis)
- Appearance: Firm, stellate (star-shaped), poorly defined grey-white mass; cut surface is hard, gritty
- The striking hardness is due to the desmoplastic stroma — an abundant fibrous reaction that can constitute up to 90% of tumour volume, compressing and distorting the pancreatic duct
- Duct dilatation: Head tumours obstruct the pancreatic duct (proximal duct dilation) and the common bile duct (obstructive jaundice, dilated intrahepatic ducts); occasionally causes double duct sign on MRCP/ERCP
Microscopic morphology:
- Well to moderately differentiated PDAC: Irregular glands and tubules lined by columnar cells with nuclear pleomorphism, prominent nucleoli, and intraluminal mucin; infiltrate into desmoplastic stroma
- Perineural invasion — cancer cells wrap around and track along nerve sheaths; almost universal in PDAC; correlates with the characteristic back/epigastric pain (destruction of coeliac plexus); also makes surgical clearance difficult
- Lymphovascular invasion — early; explains why nodal and haematogenous metastases are common even with small primary tumours
- Desmoplastic stroma: dense collagen, activated pancreatic stellate cells (the architects of the desmoplastic reaction), sparse lymphocytic infiltrate; the stroma is also a physical barrier to drug delivery
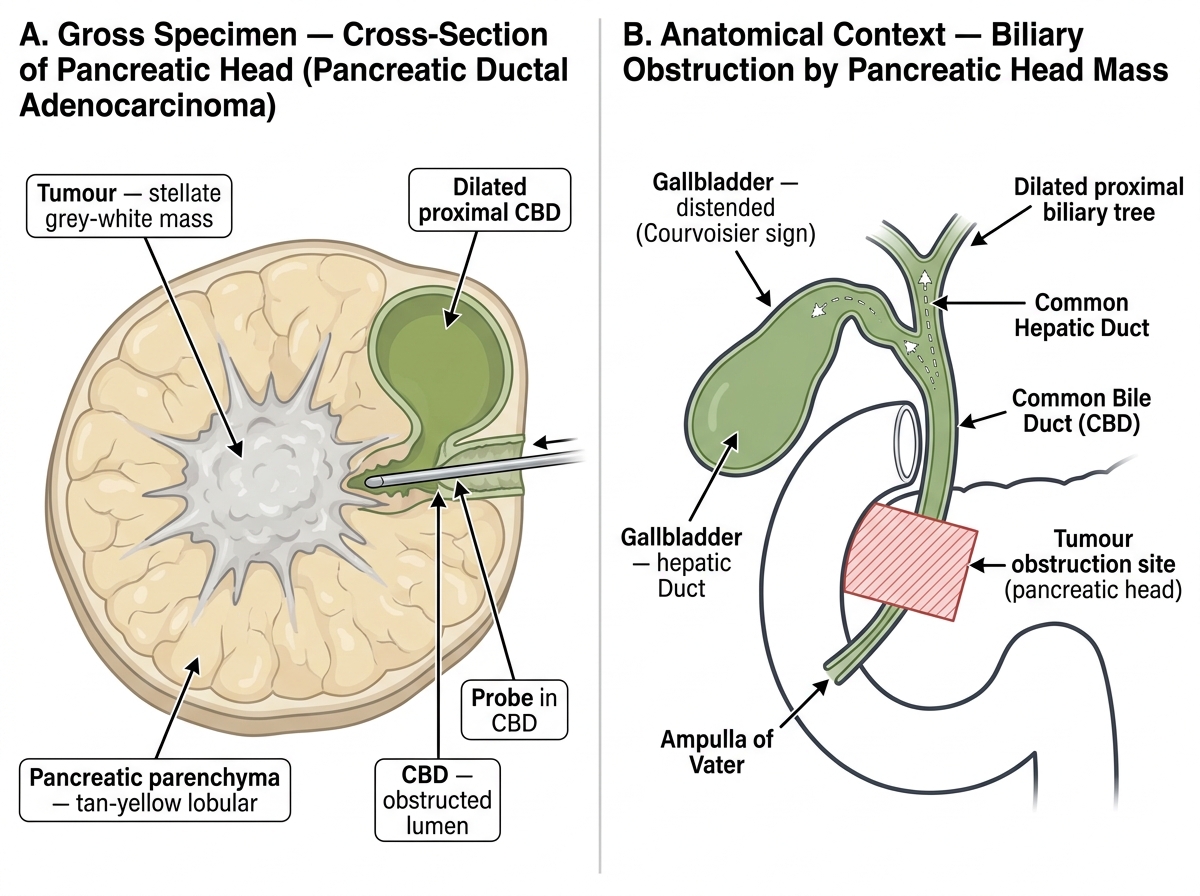
Pancreatic Ductal Adenocarcinoma — Gross Specimen Cross-Section and Biliary Obstruction Schematic
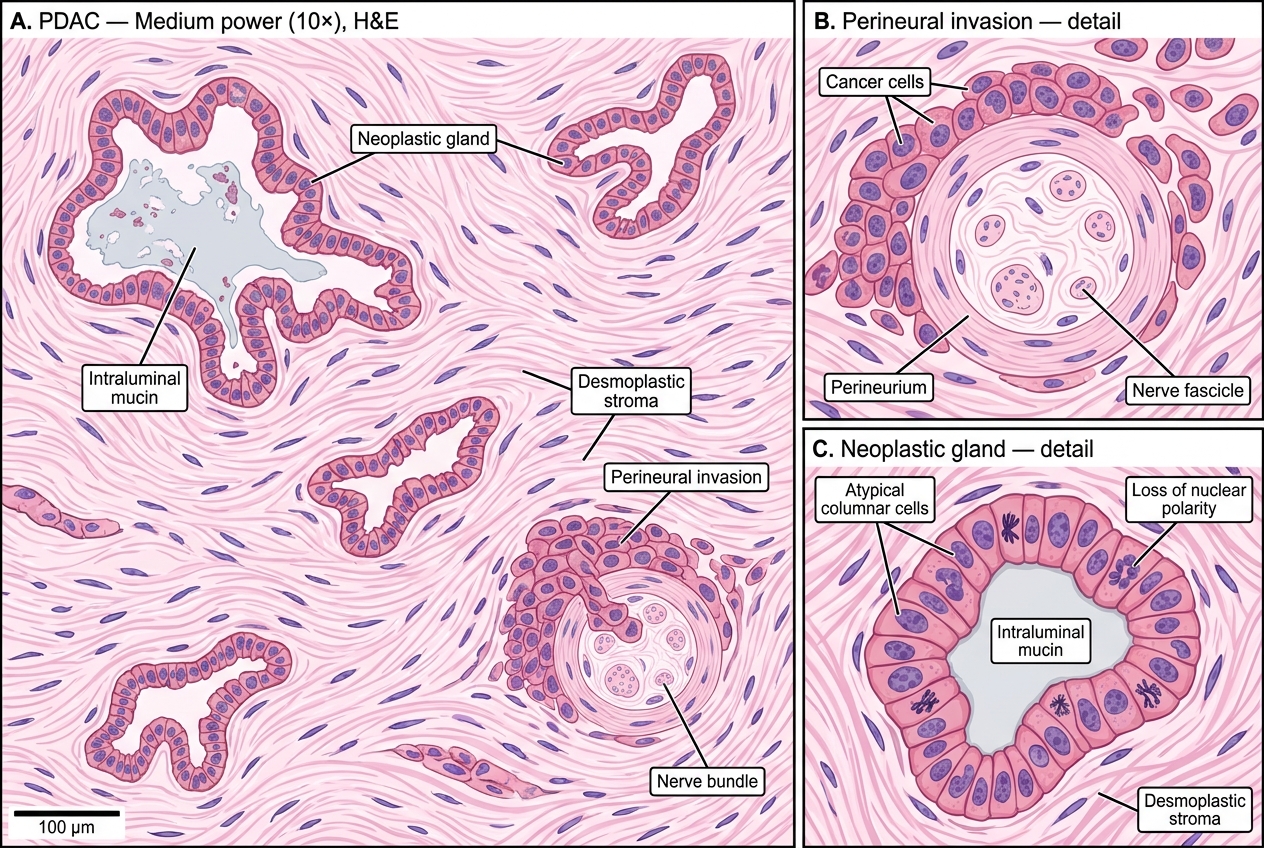
Pancreatic Ductal Adenocarcinoma — H&E Histology: Neoplastic Glands, Desmoplastic Stroma, and Perineural Invasion